
Железная дорога by Pavel888, on Flickr
РУССКИЙ ЯЗЫК/Russian language.
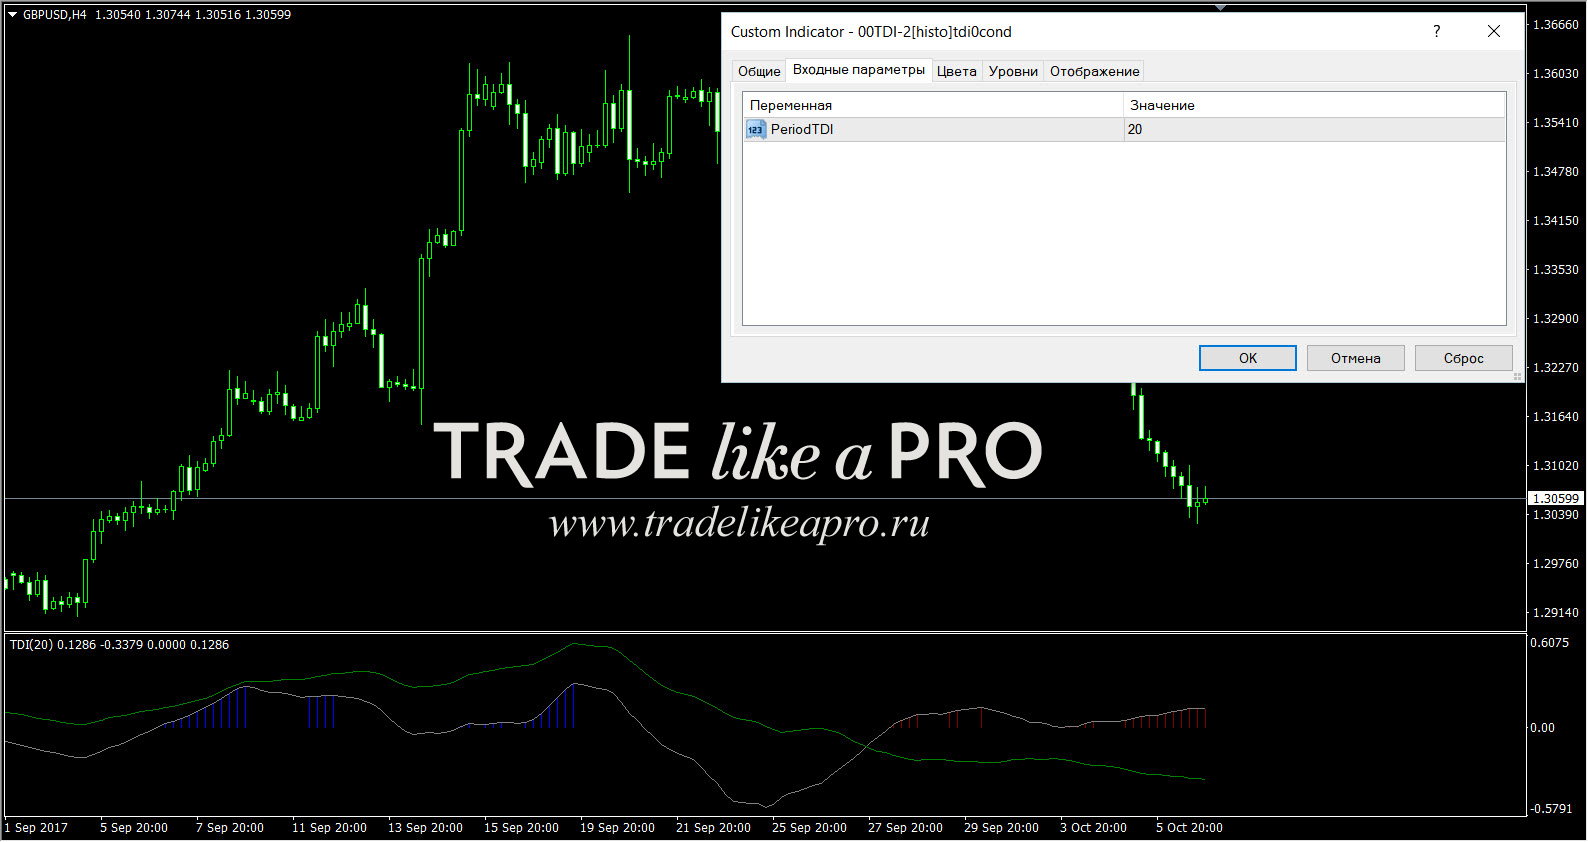
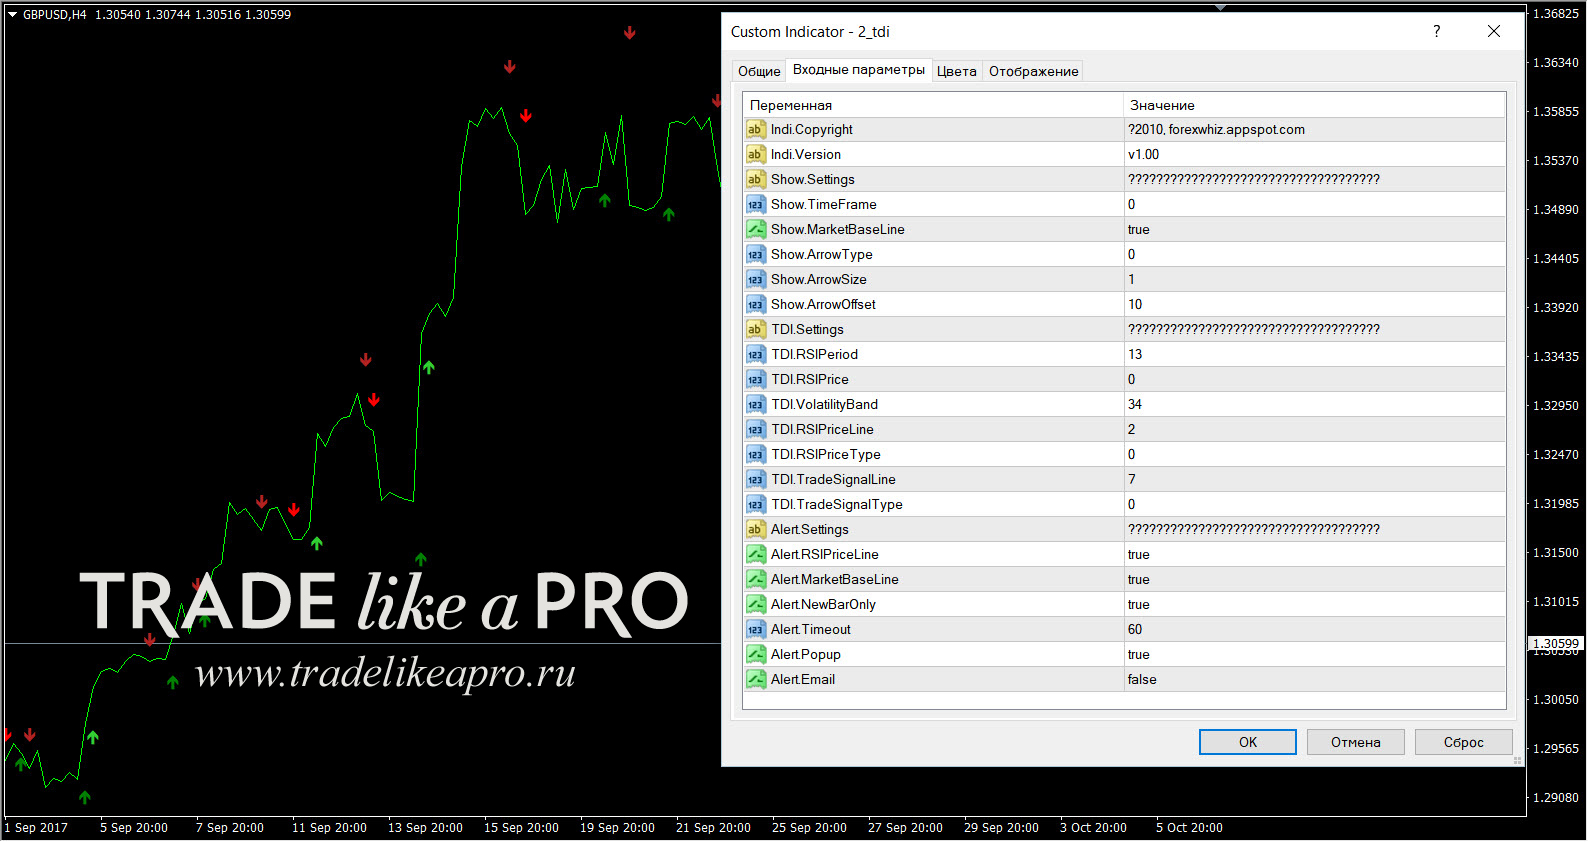
НАБОР посвящается осциллятору TDI (Traders Dynamic Index). Большинство индикаторов представлено с открытым кодом (файл mql в наличии). Однако для работы индикатора требуется файл с разрешением EX. Если указано, что нет скрина - значит индикатор выглядит как вышеозначенный; или как стандартный ТДИ из описания. Ссылки на форум ФФ, где применяется TDI как часть системы: Another simple system, Trading Made Simple и Lower risk, stress free TDI system. Эти же темы представлены у нас на сайте (и там же в темах ссылки на форуме): Another Simple System, Trading Made Simple, Stress Free TDI System.
Кроме индикаторов к темообразующему посту прикреплена папка МАНУАЛЫ. Из них самым ценным является документ SYNERGY_Basic, где есть примеры сделок с использованием TDI - рекомендую изучить внимательно. Да, вся документация на английском языке, но трейдерам для понимания не требуется особых навыков по знанию языка - по картинками интуитивно всё будет понятно. Ну или немного использовать гугл переводчик можно. Подборка фундаментальная и основательная, не имеющая аналогов в сети!
Успехов нам в работе!
АНГЛИЙСКИЙ ЯЗЫК/English language.
The SET is dedicated to the TDI (Traders Dynamic Index) oscillator. Most of the indicators are open source (mql file is available). However, for the indicator to work, a file with EX resolution is required. If it is indicated that there is no screenshot, then the indicator looks like the above; or as a standard TDI from the description. Links to the FF forum where TDI is used as part of the system: Another simple system, Trading Made Simple and Lower risk, stress free TDI system. The same topics are presented on our website (and in the same threads links on the forum): Another Simple System, Trading Made Simple, Stress Free TDI System.
In addition to the indicators, the MANUALS folder is attached to the topic-forming post. Of these, the most valuable is document SYNERGY_Basic, where there are examples of transactions using TDI - I recommend studying it carefully. Yes, all documentation is in English, but traders do not need special language skills to understand - everything will be intuitive from the pictures. Well, or you can use Google Translate a little. The selection is fundamental and thorough, having no analogues on the web!
Good luck in our work!
С уважением, Павел aka Pavel888.
ОПИСАНИЕ ИНДИКАТОРА
1. Общий вид индикатора, описание.
2. Код индикатора.
3. Базовые настройки индикатора.
4. Формула расчёта индикатора.
5. Видеообзор индикатора.
6. Автор индикатора.
1. Общий вид индикатора, описание:
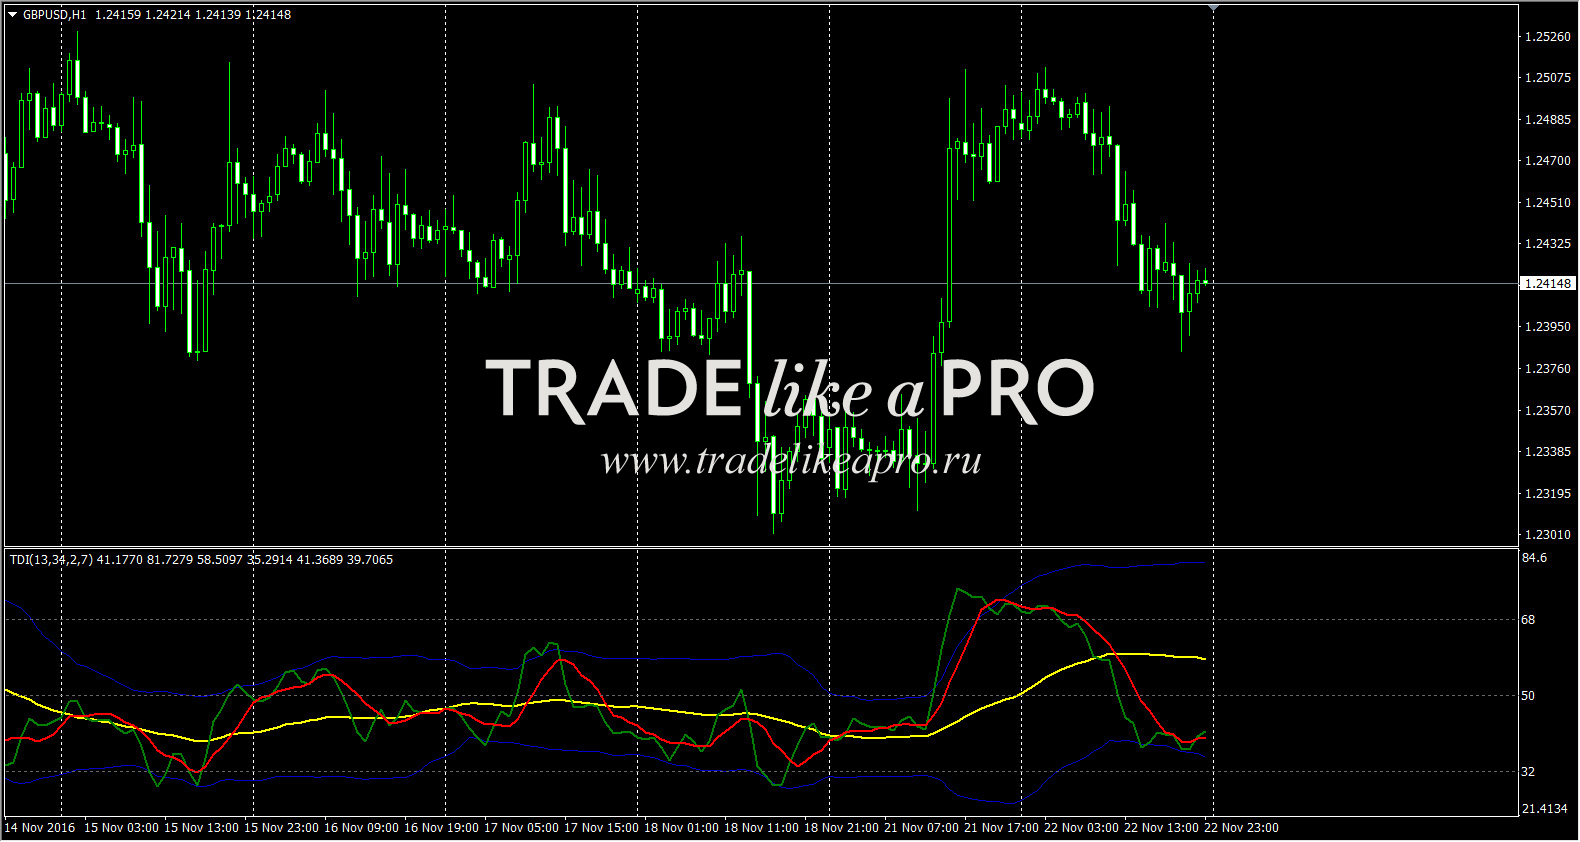
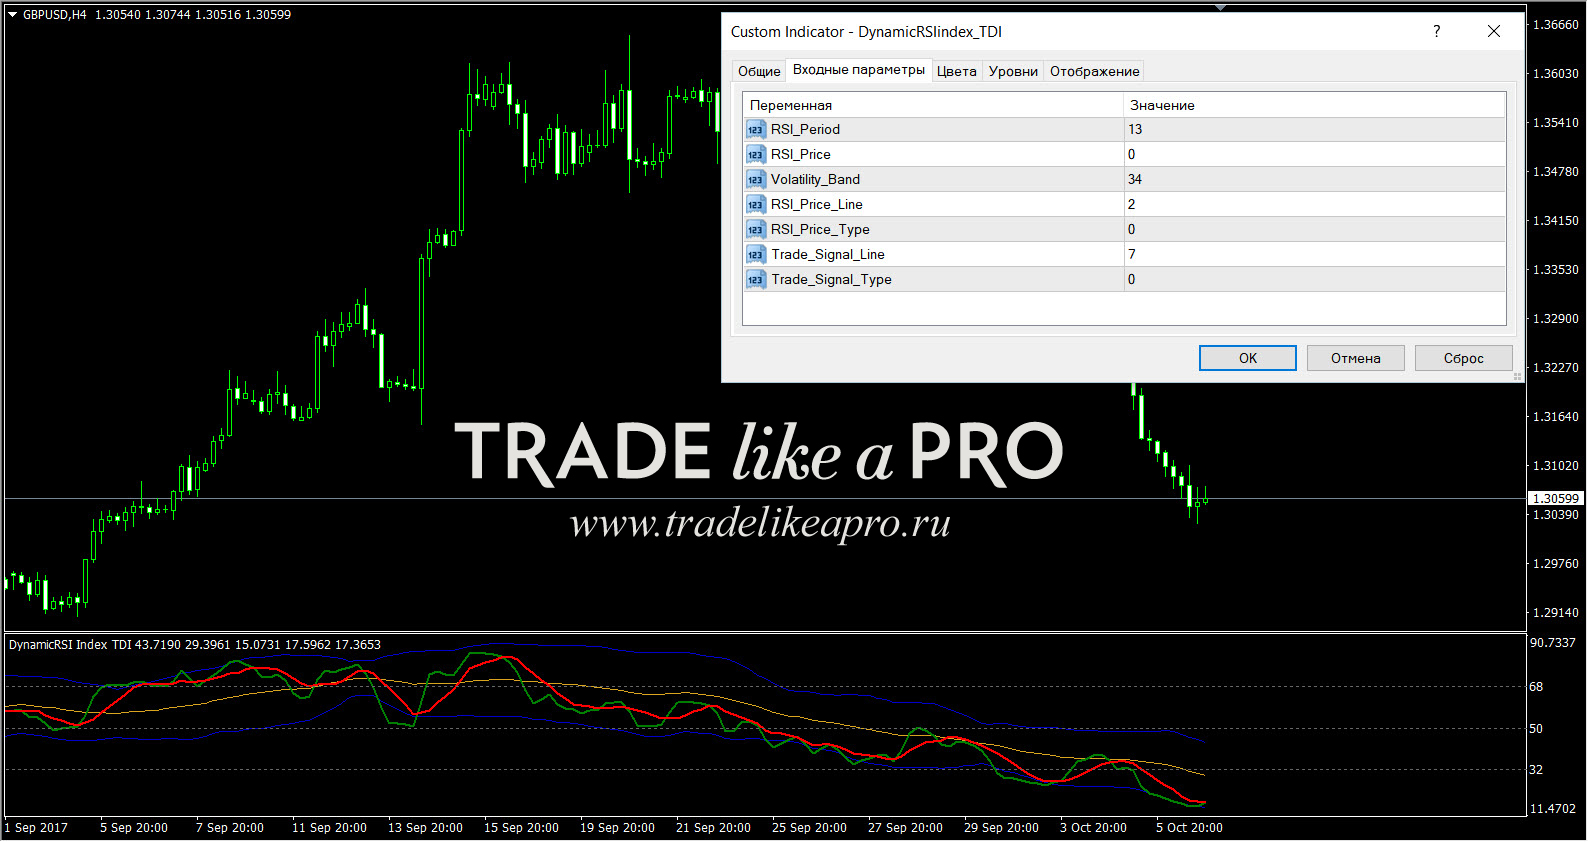
Зеленая линия (линия RSI) – сглаженные простой (по умолчанию) скользящей средней значения индикатора RSI, период сглаживания 2.
Красная линия (сигнальная линия) – сглаженные простой (по умолчанию) скользящей средней значения индикатора RSI, период сглаживания 7.
Синие линии – индикатор Bollinger bands по умолчанию период 34.
Желтая линия – высчитывается, как сумма значений верхней и нижней синей линии индикатора Bollinger bands, делённая на 2.
2. Код индикатора:
//+------------------------------------------------------------------+
//| Based on:																	      |
//|                                    Traders Dynamic Index.mq4     |
//|                                    Copyright © 2006, Dean Malone |
//|                                    www.compassfx.com             |
//+------------------------------------------------------------------+
//+------------------------------------------------------------------+
//| Updated by:                     											|
//|                                                    Andriy Moraru |
//|                                         http://www.earnforex.com |
//|            							                            2015 |
//+------------------------------------------------------------------+
#property copyright "www.EarnForex.com, 2015"
#property link      "http://www.earnforex.com"
#property version   "1.01"

//+------------------------------------------------------------------+
//|                                                                  |
//|                     Traders Dynamic Index                        |
//|                                                                  |
//|  This hybrid indicator is developed to assist traders in their   |
//|  ability to decipher and monitor market conditions related to    |
//|  trend direction, market strength, and market volatility.        |
//|                                                                  |
//|  Even though comprehensive, the T.D.I. is easy to read and use.  |
//|                                                                  |
//|  Green line = RSI Price line                                     |
//|  Red line = Trade Signal line                                    |
//|  Blue lines = Volatility Band                                    |
//|  Yellow line = Market Base Line                                  |
//|                                                                  |
//|  Trend Direction - Immediate and Overall                         |
//|   Immediate = Green over Red...price action is moving up.        |
//|               Red over Green...price action is moving down.      |
//|                                                                  |
//|   Overall = Yellow line trends up and down generally between the |
//|             lines 32 & 68. Watch for Yellow line to bounces off  |
//|             these lines for market reversal. Trade long when     |
//|             price is above the Yellow line, and trade short when |
//|             price is below.                                      |
//|                                                                  |
//|  Market Strength & Volatility - Immediate and Overall            |
//|   Immediate = Green Line - Strong = Steep slope up or down.      |
//|                            Weak = Moderate to Flat slope.        |
//|                                                                  |
//|   Overall = Blue Lines - When expanding, market is strong and    |
//|             trending. When constricting, market is weak and      |
//|             in a range. When the Blue lines are extremely tight  |
//|             in a narrow range, expect an economic announcement   |
//|             or other market condition to spike the market.       |
//|                                                                  |
//|                                                                  |
//|  Entry conditions                                                |
//|   Scalping  - Long = Green over Red, Short = Red over Green      |
//|   Active - Long = Green over Red & Yellow lines                  |
//|            Short = Red over Green & Yellow lines                 |
//|   Moderate - Long = Green over Red, Yellow, & 50 lines           |
//|              Short= Red over Green, Green below Yellow & 50 line |
//|                                                                  |
//|  Exit conditions*                                                |
//|   Long = Green crosses below Red                                 |
//|   Short = Green crosses above Red                                |
//|   * If Green crosses either Blue lines, consider exiting when    |
//|     when the Green line crosses back over the Blue line.         |
//|                                                                  |
//|                                                                  |
//|  IMPORTANT: The default settings are well tested and proven.     |
//|             But, you can change the settings to fit your         |
//|             trading style.                                       |
//|                                                                  |
//|   Good trading,                                                  |
//|                                                                  |
//|   Dean                                                           |
//+------------------------------------------------------------------+

#property description "Shows trend direction, strength, and volatility."
#property description "Green line  - RSI Price line."
#property description "Red line    - Trade Signal line."
#property description "Blue lines  - Volatility Band."
#property description "Yellow line - Market Base line."

#property indicator_separate_window
#property indicator_buffers 6
#property indicator_level1 32
#property indicator_level2 50
#property indicator_level3 68
#property indicator_levelcolor clrDimGray
#property indicator_levelstyle STYLE_DOT
#property indicator_levelwidth 1
#property indicator_color1 clrNONE
#property indicator_type1  DRAW_NONE
#property indicator_color2 clrMediumBlue
#property indicator_label2 "VB High"
#property indicator_type2  DRAW_LINE
#property indicator_width2 1
#property indicator_style2 STYLE_SOLID
#property indicator_color3 clrYellow
#property indicator_label3 "Market Base Line"
#property indicator_type3  DRAW_LINE
#property indicator_width3 2
#property indicator_style3 STYLE_SOLID
#property indicator_color4 clrMediumBlue
#property indicator_label4 "VB Low"
#property indicator_type4  DRAW_LINE
#property indicator_width4 1
#property indicator_style4 STYLE_SOLID
#property indicator_color5 clrGreen
#property indicator_label5 "RSI Price Line"
#property indicator_type5  DRAW_LINE
#property indicator_width5 2
#property indicator_style5 STYLE_SOLID
#property indicator_color6 clrRed
#property indicator_label6 "Trade Signal Line"
#property indicator_type6  DRAW_LINE
#property indicator_width6 2
#property indicator_style6 STYLE_SOLID

input int RSI_Period = 13; // RSI_Period: 8-25
input ENUM_APPLIED_PRICE RSI_Price = PRICE_CLOSE;
input int Volatility_Band = 34; // Volatility_Band: 20-40
input double StdDev = 1.6185; // Standard Deviations: 1-3
input int RSI_Price_Line = 2;
input ENUM_MA_METHOD RSI_Price_Type = MODE_SMA;
input int Trade_Signal_Line = 7;
input ENUM_MA_METHOD Trade_Signal_Type = MODE_SMA;
input bool UseAlerts = false;

double RSIBuf[], UpZone[], MdZone[], DnZone[], MaBuf[], MbBuf[];

int AlertPlayedonBar = 0;

//+------------------------------------------------------------------+
//| Custom indicator initialization function                         |
//+------------------------------------------------------------------+
int init()
{
   IndicatorShortName("TDI(" + IntegerToString(RSI_Period) + "," + IntegerToString(Volatility_Band) + "," + IntegerToString(RSI_Price_Line) + "," + IntegerToString(Trade_Signal_Line) +  ")");

   SetIndexBuffer(0, RSIBuf);
   SetIndexBuffer(1, UpZone);
   SetIndexBuffer(2, MdZone);
   SetIndexBuffer(3, DnZone);
   SetIndexBuffer(4, MaBuf);
   SetIndexBuffer(5, MbBuf);

   return(0);
}

//+------------------------------------------------------------------+
//| Traders Dynamic Index                                            |
//+------------------------------------------------------------------+
int start()
{
   double MA, RSI[];
   ArrayResize(RSI, Volatility_Band);

   int counted_bars = IndicatorCounted();
   int limit = Bars - counted_bars - 1;

   for (int i = limit; i >= 0; i--)
   {
      RSIBuf = iRSI(NULL, 0, RSI_Period, RSI_Price, i);
      MA = 0;
      for (int x = i; x       {
         RSI[x - i] = RSIBuf[x];
         MA += RSIBuf[x] / Volatility_Band;
      }
      double SD = StdDev * StDev(RSI, Volatility_Band);
      UpZone = MA + SD;
      DnZone = MA - SD;
      MdZone = (UpZone + DnZone) / 2;
   }
   for (i = limit - 1; i >= 0; i--)
   {
      MaBuf = iMAOnArray(RSIBuf, 0, RSI_Price_Line, 0, RSI_Price_Type, i);
      MbBuf = iMAOnArray(RSIBuf, 0, Trade_Signal_Line, 0, Trade_Signal_Type, i);
   }
   if ((MbBuf[0] > MdZone[0]) && (MbBuf[1]    {
      Alert("Bullish cross");
      PlaySound("alert.wav");
      AlertPlayedonBar = Bars;
   }
   if ((MbBuf[0] = MdZone[1]) && (UseAlerts == true) && (AlertPlayedonBar != Bars))
   {
      Alert("Bearish cross");
      PlaySound("alert.wav");
      AlertPlayedonBar = Bars;
   }

   return(0);
}

// Standard Deviation function.
double StDev(double& Data[], int Per)
{
	return(MathSqrt(Variance(Data, Per)));
}

// Math Variance function.
double Variance(double& Data[], int Per)
{
	double sum = 0, ssum = 0;
	for (int i = 0; i 	{
		sum += Data;
		ssum += MathPow(Data, 2);
	}
	return((ssum * Per - sum * sum) / (Per * (Per - 1)));
}
//+------------------------------------------------------------------+
3. Базовые настройки индикатора.
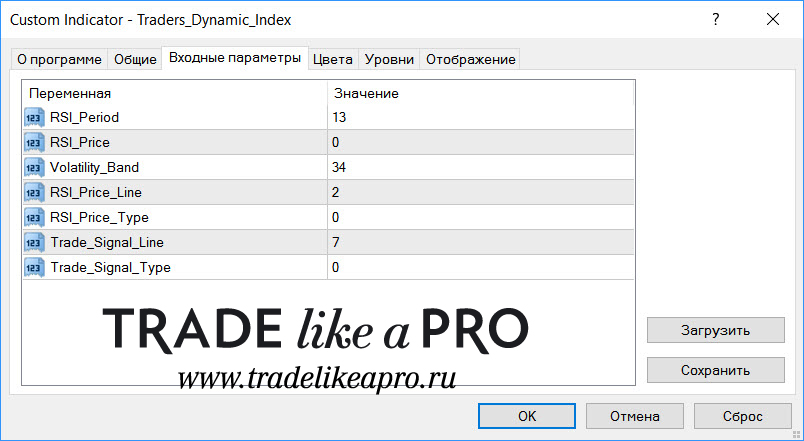
RSI_Period - (по умолчанию 13) – период RSI, сама линия RSI не строится, его значение используются для дальнейшего вычисления линий индикатора;
RSI_Price - (0) – применить расчет RSI к значению цены (по умолчанию «Close»);
Volatility_Band - (34) – здесь устанавливается значение периода индикатора Bollinger bands;
RSI_Price_Line - (2) – здесь задаётся период скользящей средней (зеленая линия);
RSI_Price_Type - (0) – метод расчета скользящей средней, задается в виде цифр:
0 – простой (Simple);
1 – экспоненциальный (Exponential);
2 – сглаженный (Smoothed);
3 – линейно-взвешенный (Linear Weighted).
Trade_Signal_Line - (7) – период скользящей средней сигнальной красной линии;
Trade_Signal_Type - (0) – метод расчета скользящей средней, задается как по аналогии с параметром RSI_Price_Type.
4. Формула расчёта индикатора.
5. Видеообзор индикатора.
Traders Dynamic Index — тот самый индикатор
6. Автор индикатора.
Автор индикатора - трейдер Дэн Малоне (Dean Malone).

СПИСОК И КОМПЛЕКТАЦИЯ ВСЕХ ИНДИКАТОРОВ
!SM_TDI EX
@TMS_TDI_Slope EX
@TMS_TDI_SlopeAlert EX
@TMSTDI_WatchDog EX
00TDI-2[histo]tdi0cond EX & MQL
2_tdi EX & MQL
2tdi_rsx_based_-_smoothed_amp_alerts EX
DynamicRSIindex_TDI EX & MQL
i_TDI_MA_01 EX & MQL
lv_TDI_RT (colorful) EX & MQL
MTFTDI EX & MQL
Synergy_Pro_TDI EX & MQL
Synergy_TDI_Basic EX
TDI Alert Crossover EX & MQL
TDI Alert EX & MQL
TDI alerts advanced EX & MQL
TDI alerts advanced v2(1) EX
TDI Alerts v3.0 Repaired EX & MQL
TDI Alerts v3 EX & MQL
TDI Alerts v4 EX & MQL
TDI Dashboard V2 EX & MQL
TDI Red Green (1) EX & MQL
TDI Red Green Alert EX & MQL
TDI Red Green Alerts mod. 2015.fxdaytrader EX & MQL
TDI Red Green Tape w alerts EX & MQL
TDI Red Green Tape EX & MQL
TDI Red Green with Stochastic Alert EX & MQL
TDI Red Green EX & MQL
TDI Red Green_alerts_mtf 2.02 EX & MQL
TDI Red Green_Stoch-Kino (1) EX
TDI rsx based - smoothed & alerts+lines2 EX & MQL
TDI rsx based - smoothed & alerts+lines2 - LE 1 EX & MQL
TDI(-) EX
TDI EX & MQL
TDI_Divergence_V1.1 EX & MQL
TDI_mtf+alerts 2 b600+ EX & MQL
TDI_mtf+alerts b600+ EX & MQL
TDI_RSI_10 EX
TDI_RT alerts + divergence EX
TDI_RT EX & MQL
tdi_smoothed2_amp_alerts EX & MQL
TDI_TradeAnnouncer EX & MQL
TDI-Arrow v1.00 EX & MQL
TDIModFac EX & MQL
TDI-MTF v1.02 EX & MQL
TDI-MTF v1.600 EX & MQL
TDI-MTF EX
TDI-MTF-zz EX & MQL
TDI-MTF-zz_Band EX & MQL
TDI-MTF-zz-Matrix 3TF EX & MQL
TDINoInput EX
TDINoInputC EX & MQL
TDI-RGo EX & MQL
TDI-RSIPriceLine-MTF EX & MQL
TDI-RT-Clone EX & MQL
TDISimpleDashMod EX
TDISingle EX & MQL
TDI-sub EX & MQL
TDI-TL EX & MQL
TDI-With Alerts EX & MQL
TMS-Matrix 3TF EX
TMS-MTF EX
TMS-Tape MTF EX
TMSTDI_WatchDog EX
Traders Dynamic Index SSA ep_sharp - main chart EX & MQL
Traders Dynamic Index VISUAL ALERTS EX & MQL
Traders Dynamic Index EX & MQL
Traders_Dynamic_Index EX & MQL
TradersDynamicIndex EX & MQL
xTDI Strong-Histo v1.01 EX & MQL
xTDI-Arrow v1.00 EX & MQL
xTDI-Histo v1.10 EX & MQL
xTDI-Histo v1.11 EX & MQL
ОПИСАНИЯ И СКРИНЫ ИНДИКАТОРОВ
!SM_TDI
@TMS_TDI_Slope
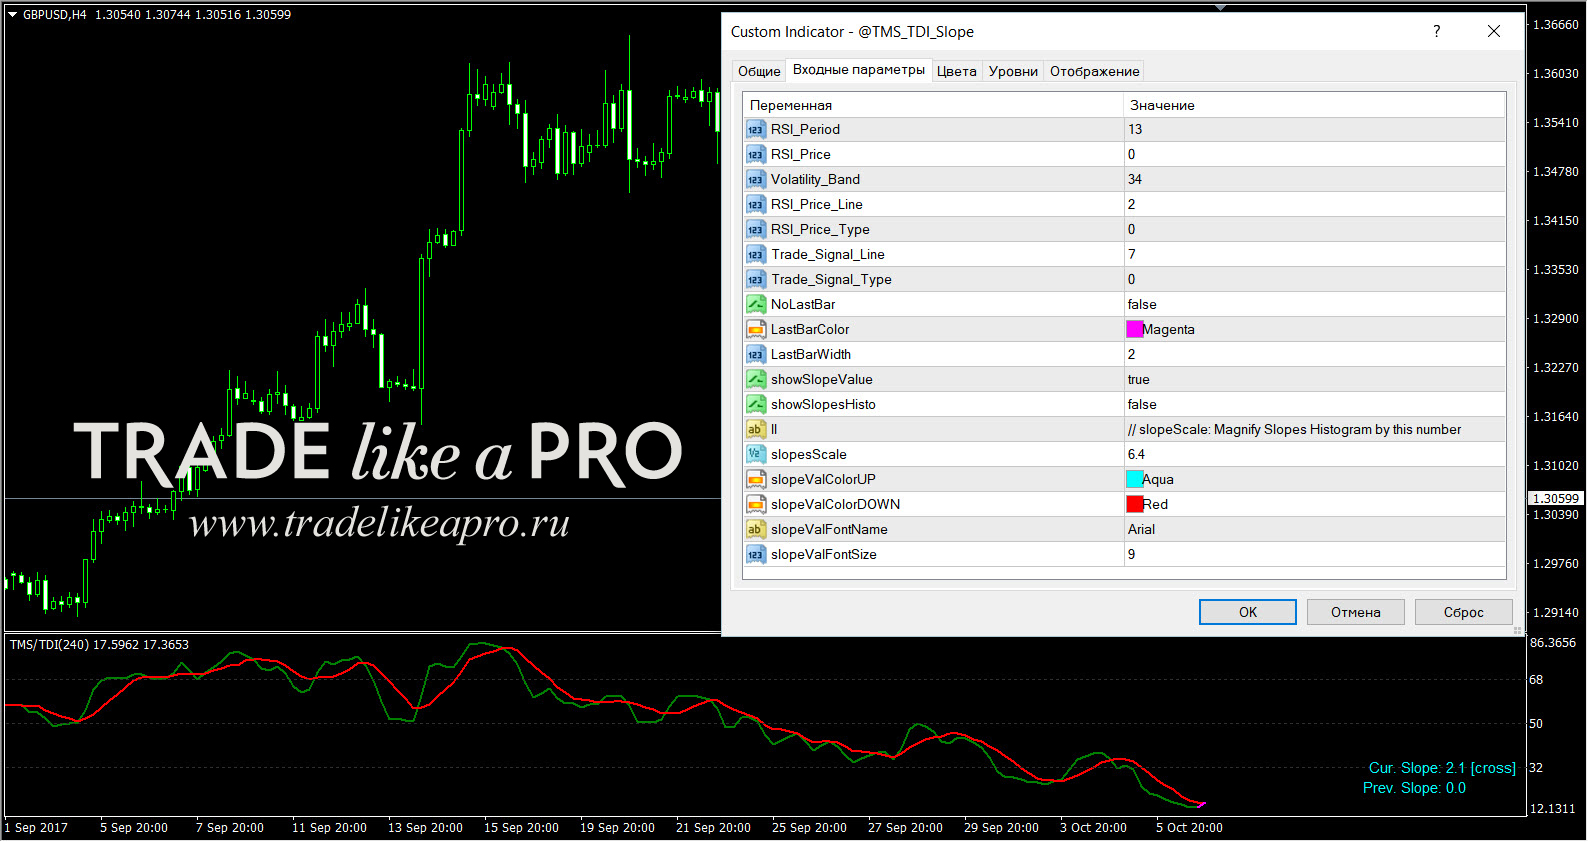
@TMS_TDI_SlopeAlert
@TMSTDI_WatchDog
00TDI-2[histo]tdi0cond
2_tdi
2tdi_rsx_based_-_smoothed_amp_alerts

DynamicRSIindex_TDI
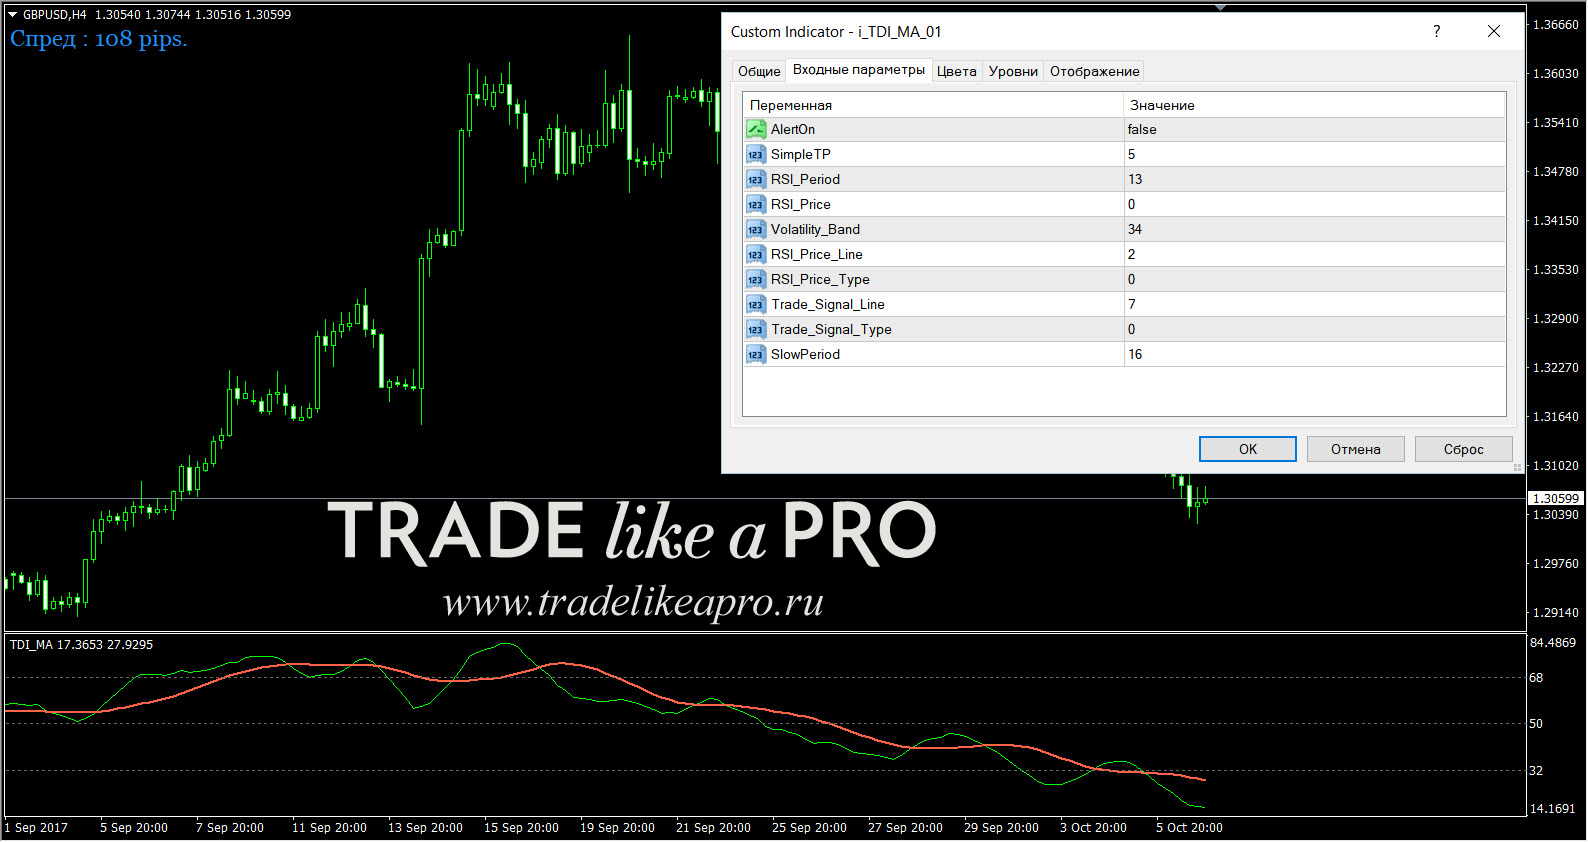
i_TDI_MA_01
lv_TDI_RT (colorful)
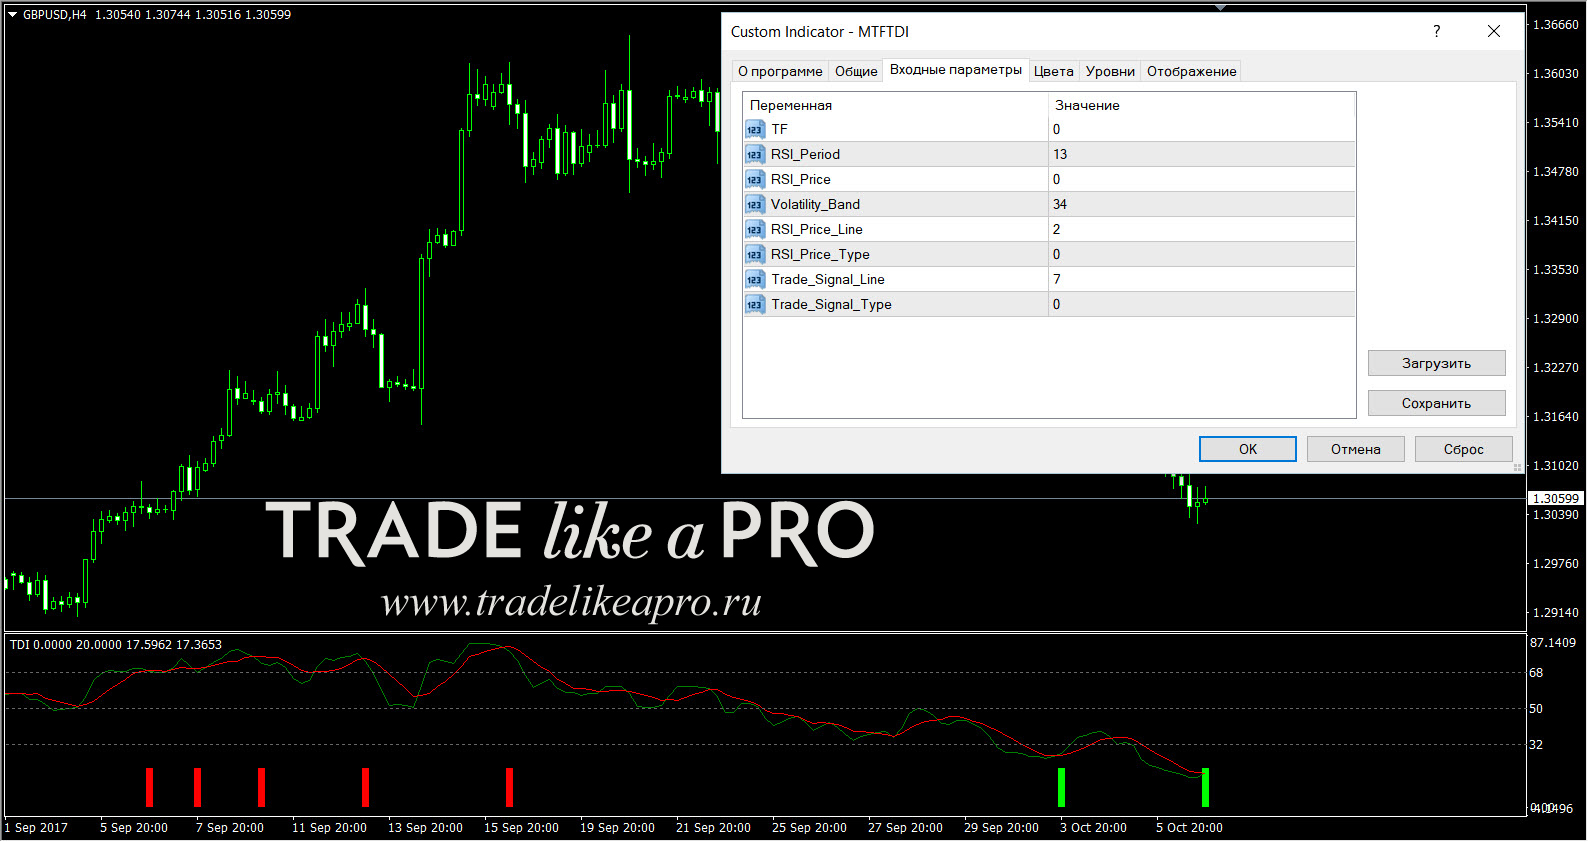
MTFTDI
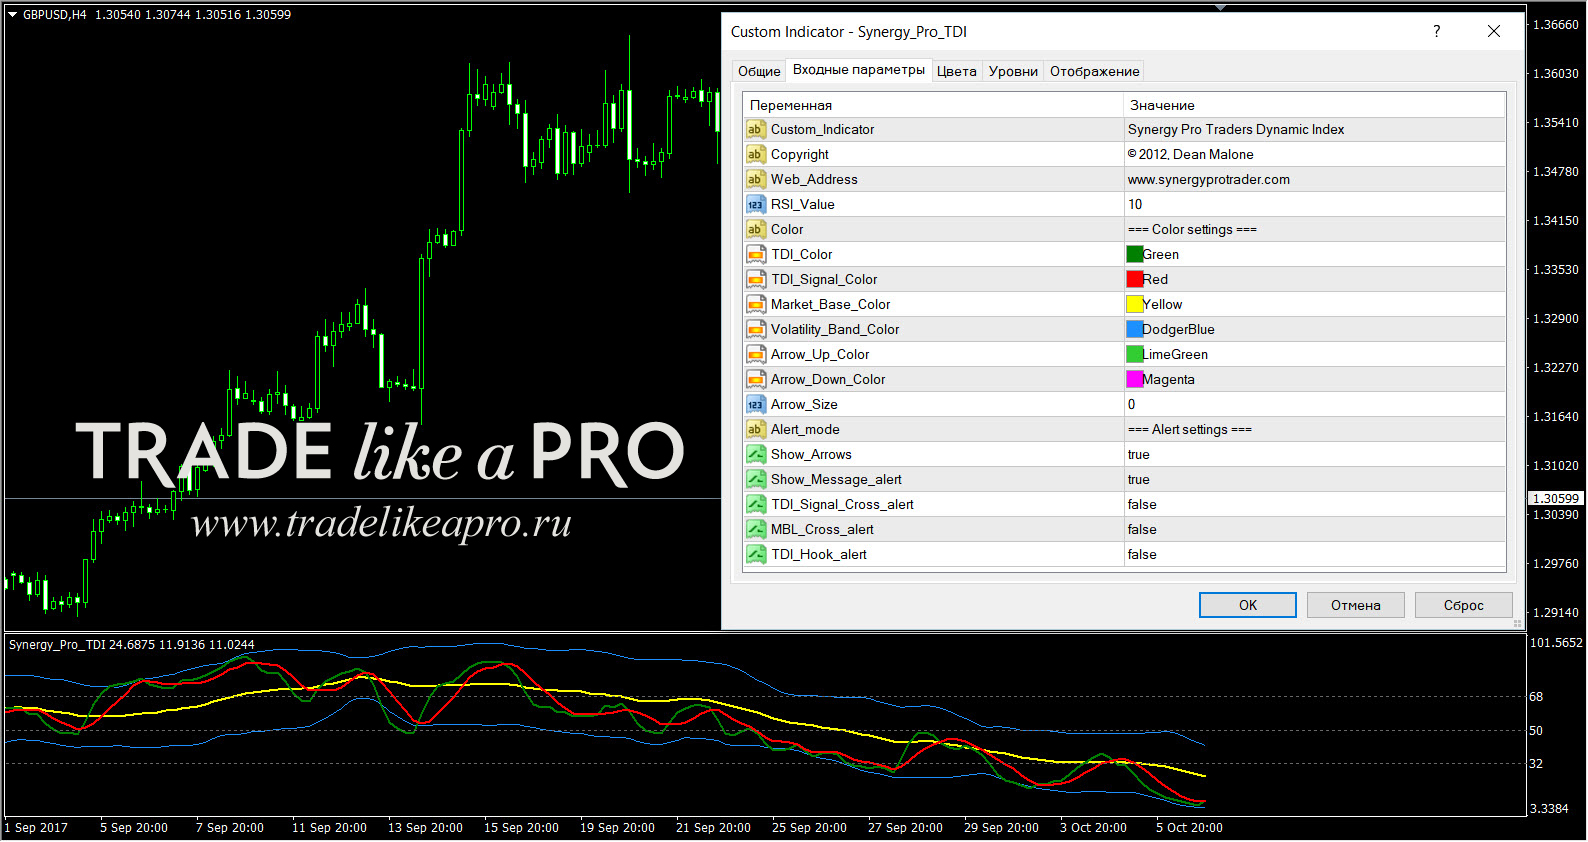
Synergy_Pro_TDI
Synergy_TDI_Basic
TDI Alert Crossover
TDI Alert
TDI alerts advanced
TDI alerts advanced v2(1)
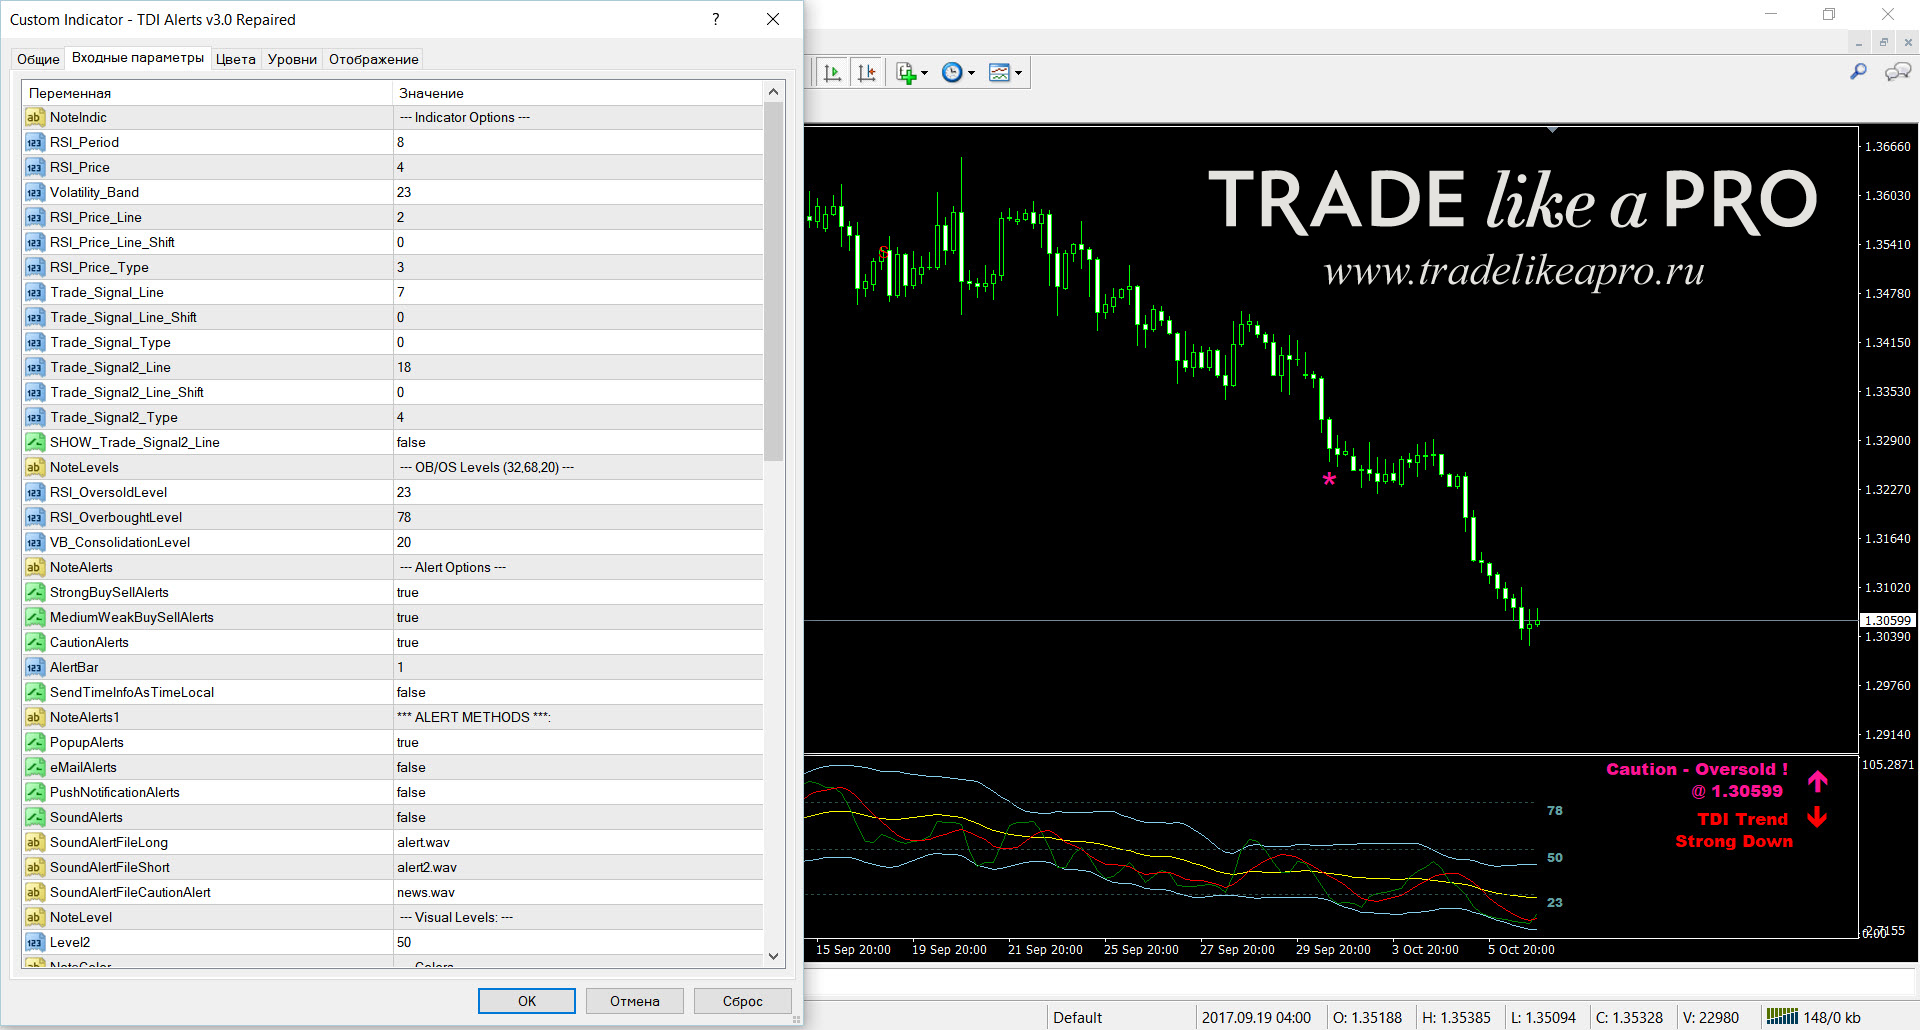
TDI Alerts v3.0 Repaired
TDI Alerts v3
TDI Alerts v4
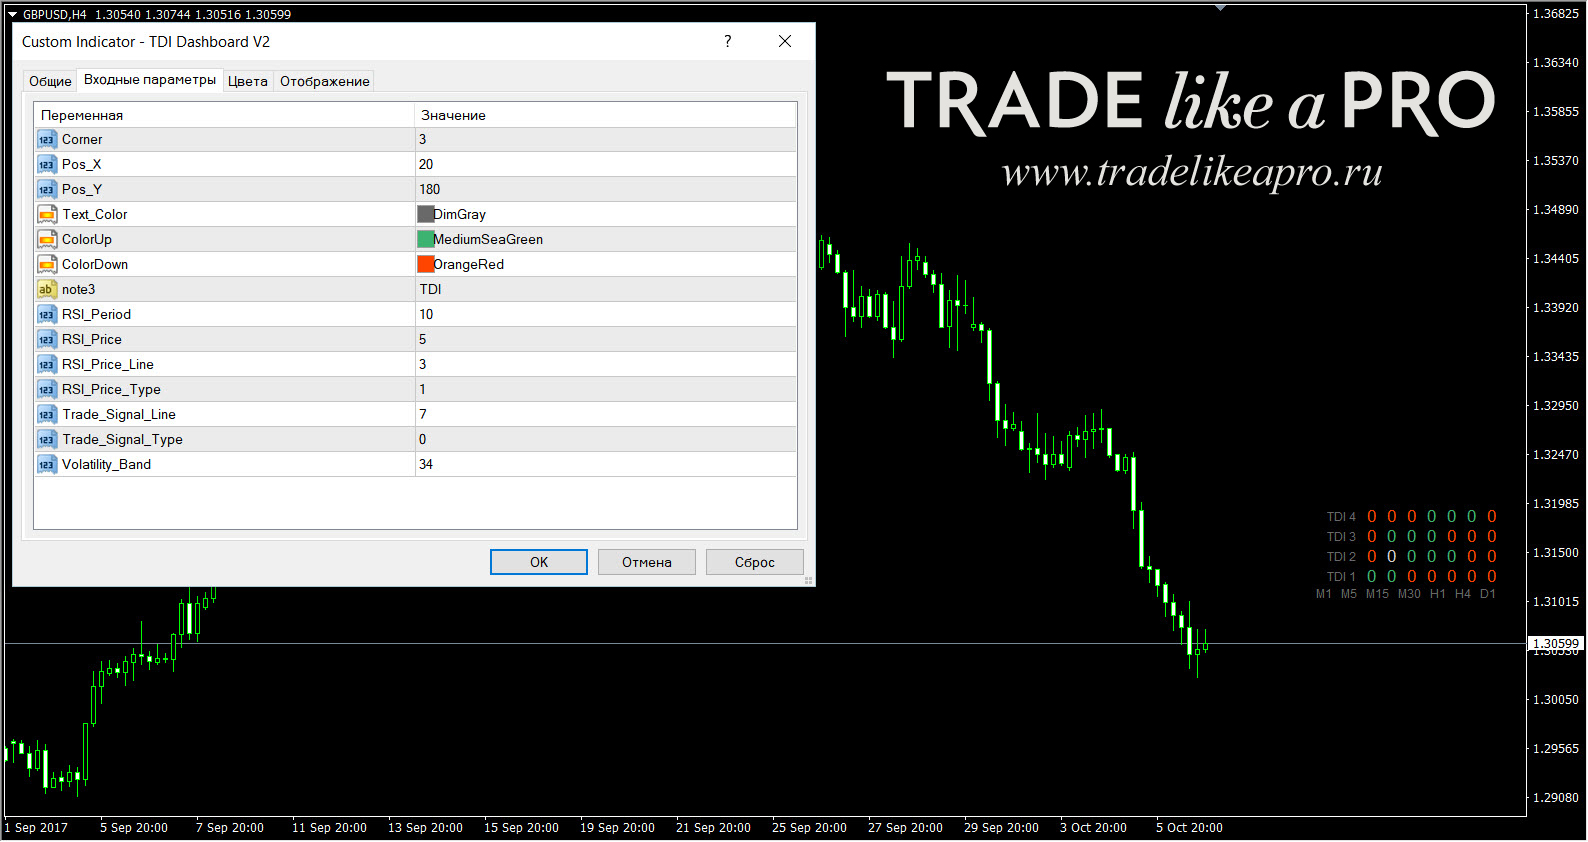
TDI Dashboard V2
TDI Red Green (1)
TDI Red Green Alert
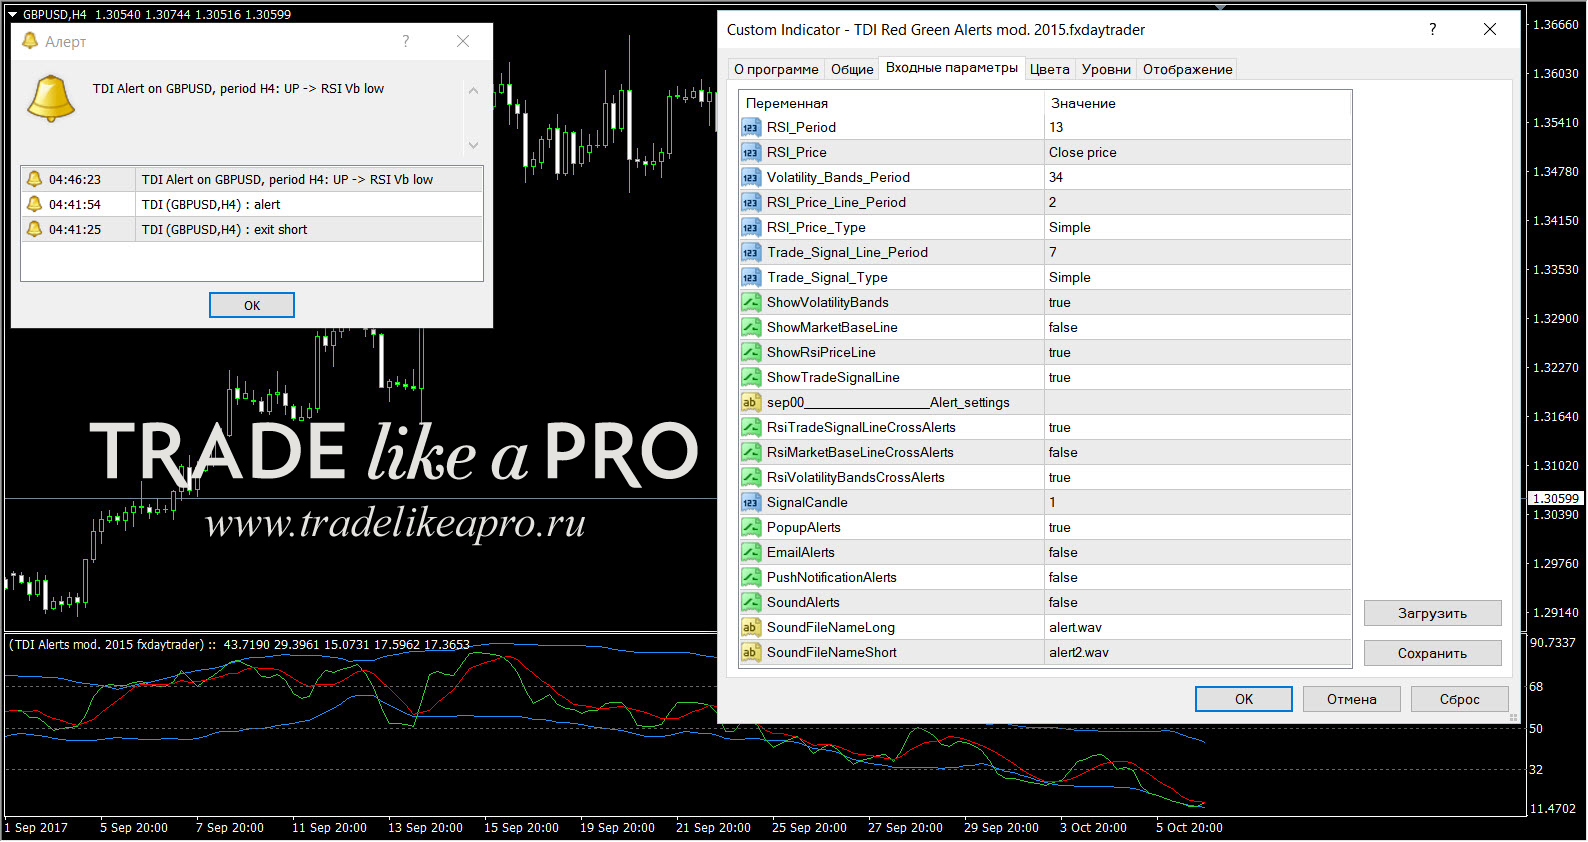
TDI Red Green Alerts mod. 2015.fxdaytrader
TDI Red Green Tape w alerts
TDI Red Green Tape
TDI Red Green with Stochastic Alert
TDI Red Green
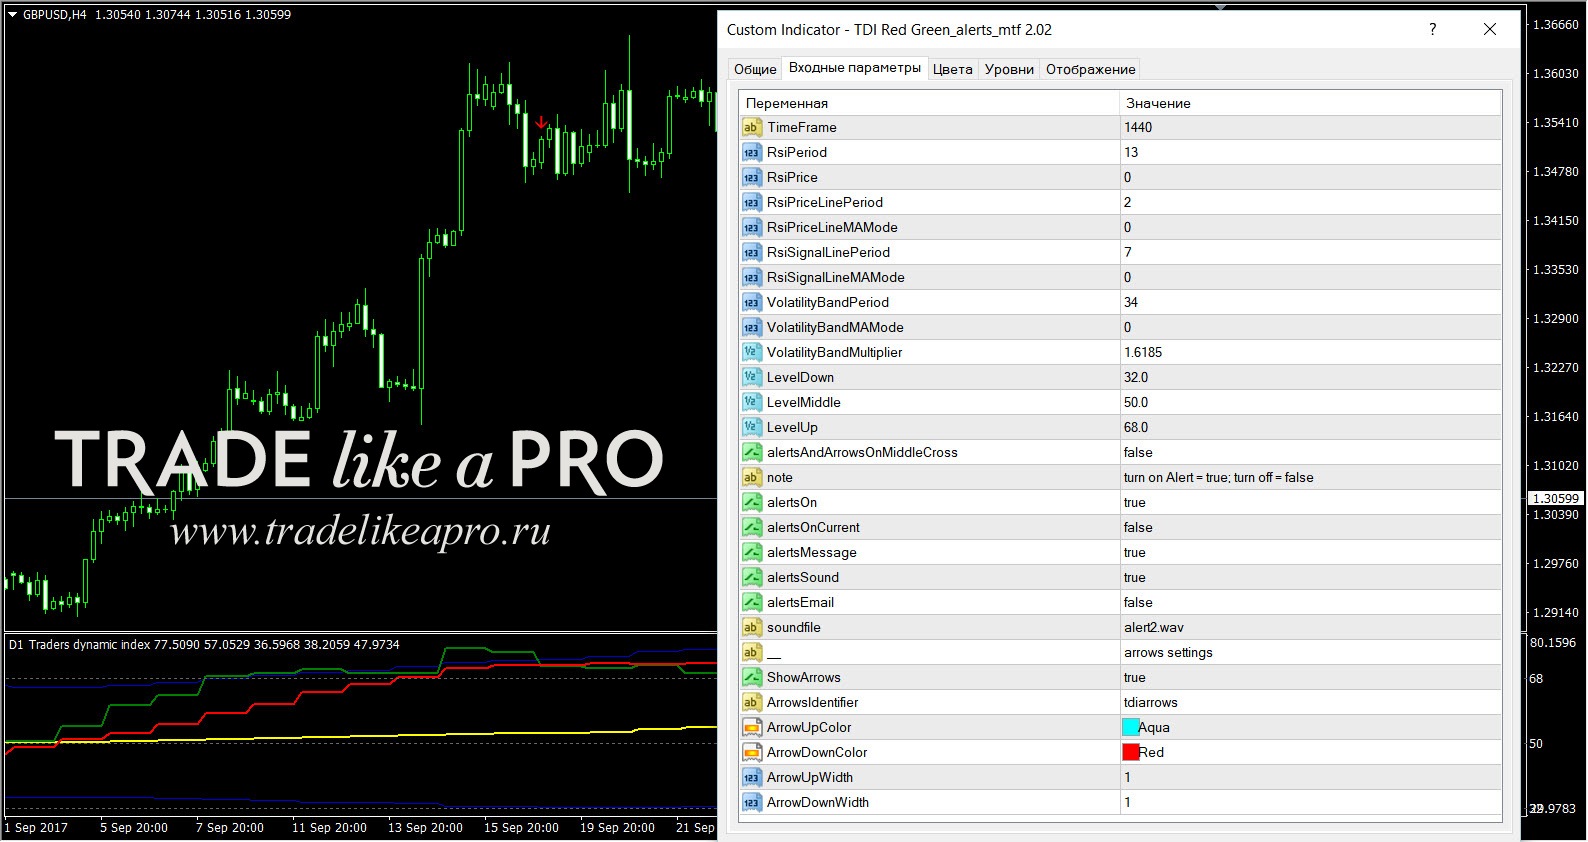
TDI Red Green_alerts_mtf 2.02
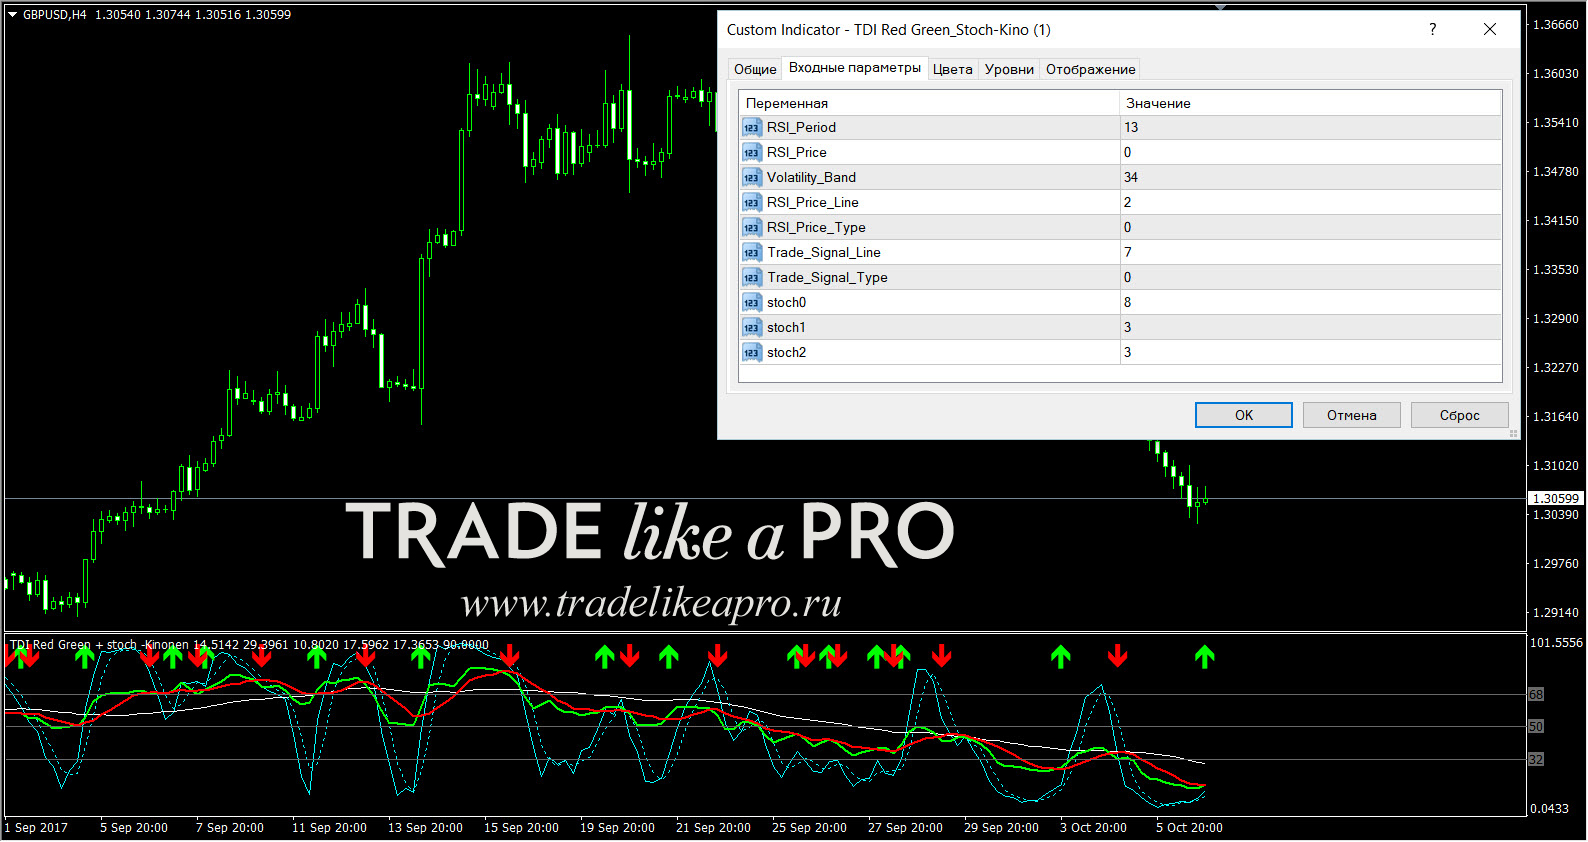
TDI Red Green_Stoch-Kino (1)
TDI rsx based - smoothed & alerts+lines2
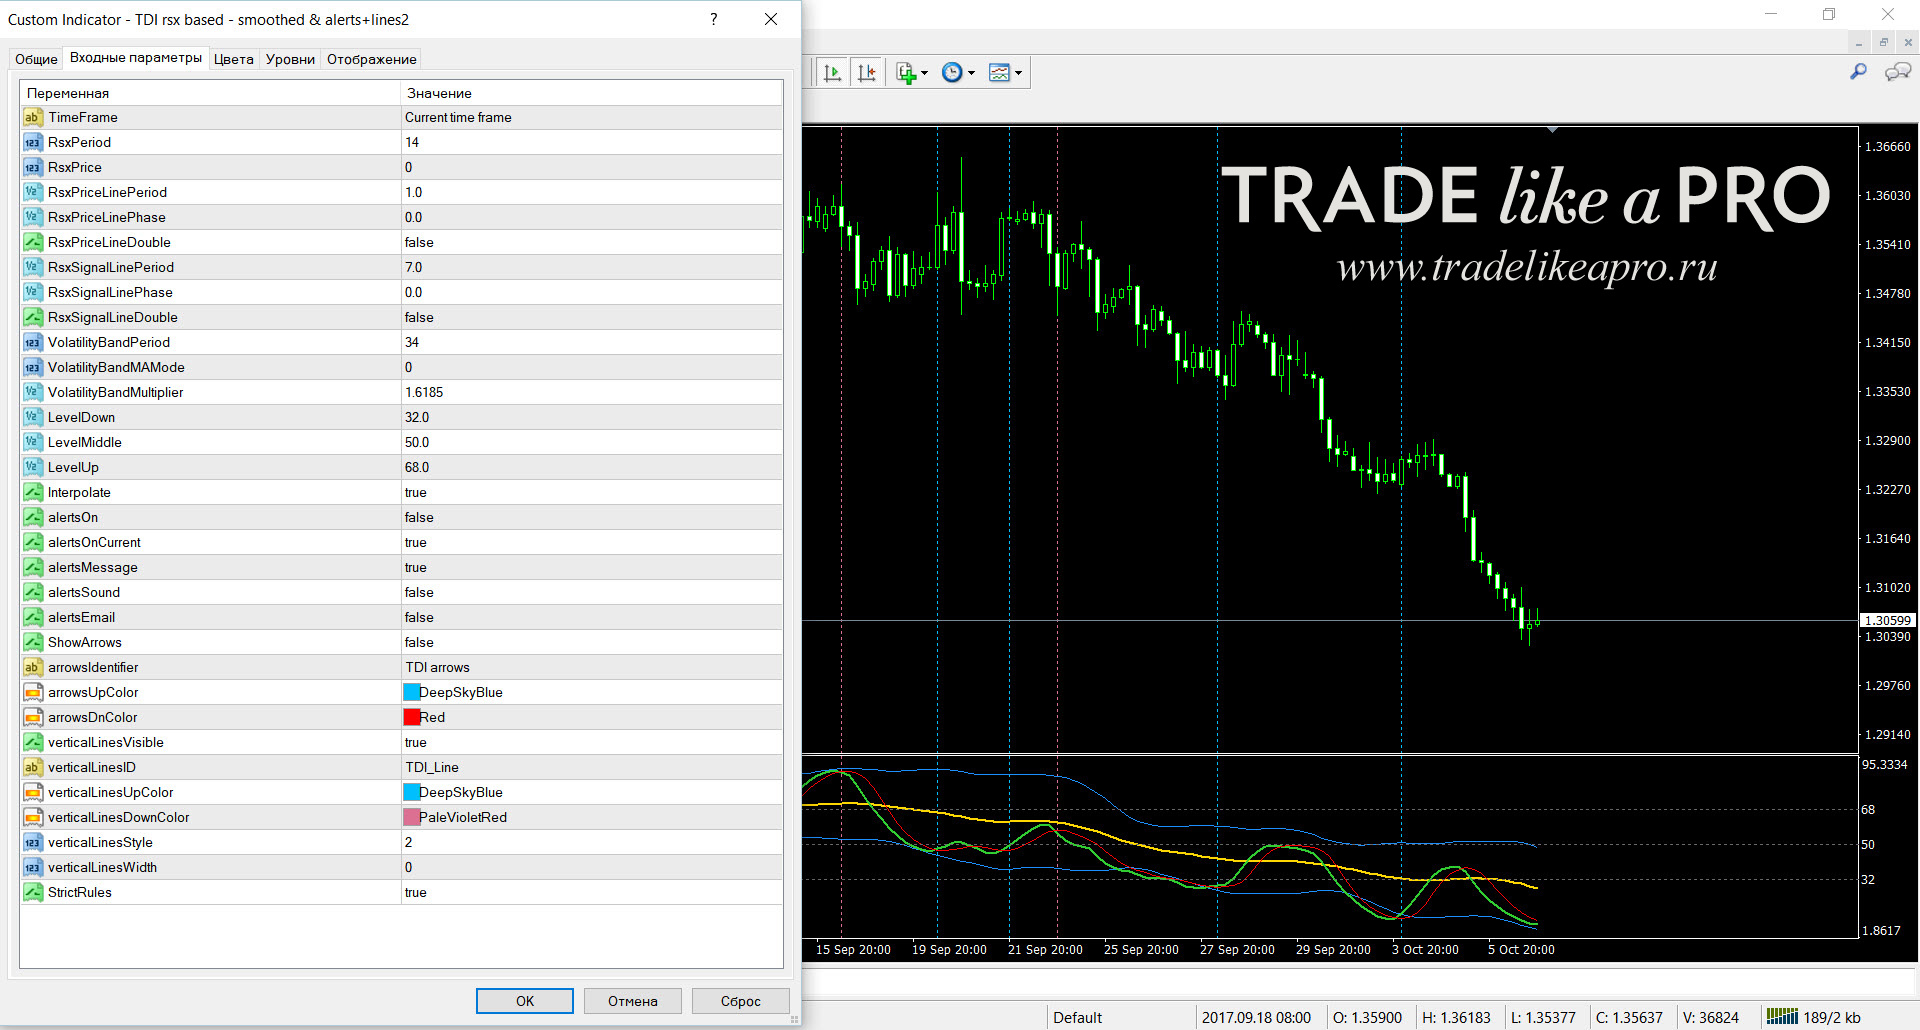
TDI rsx based - smoothed & alerts+lines2 - LE 1
TDI(-)
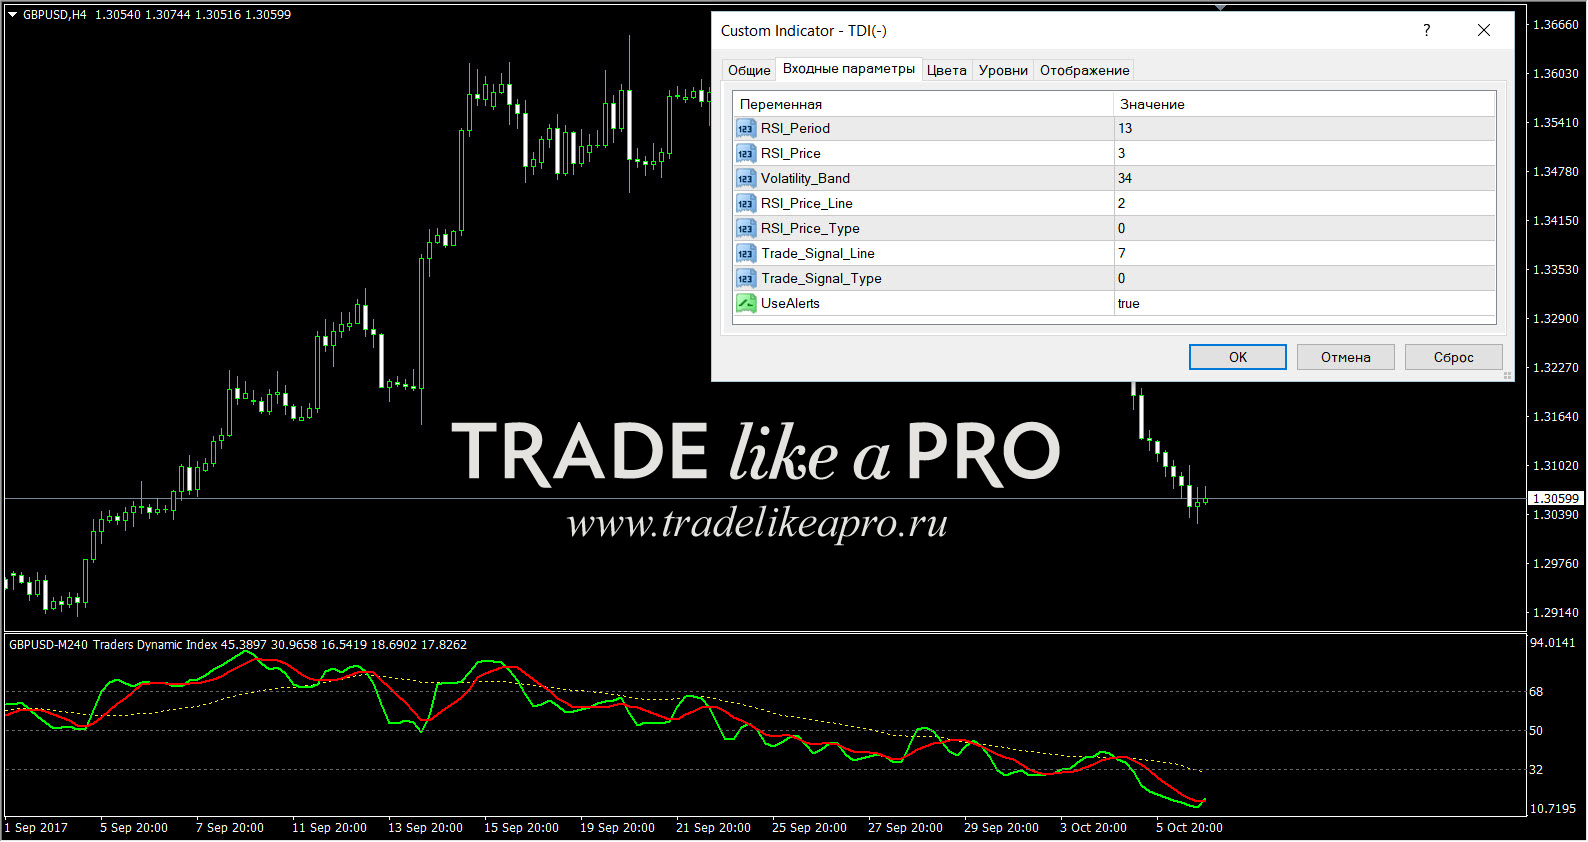
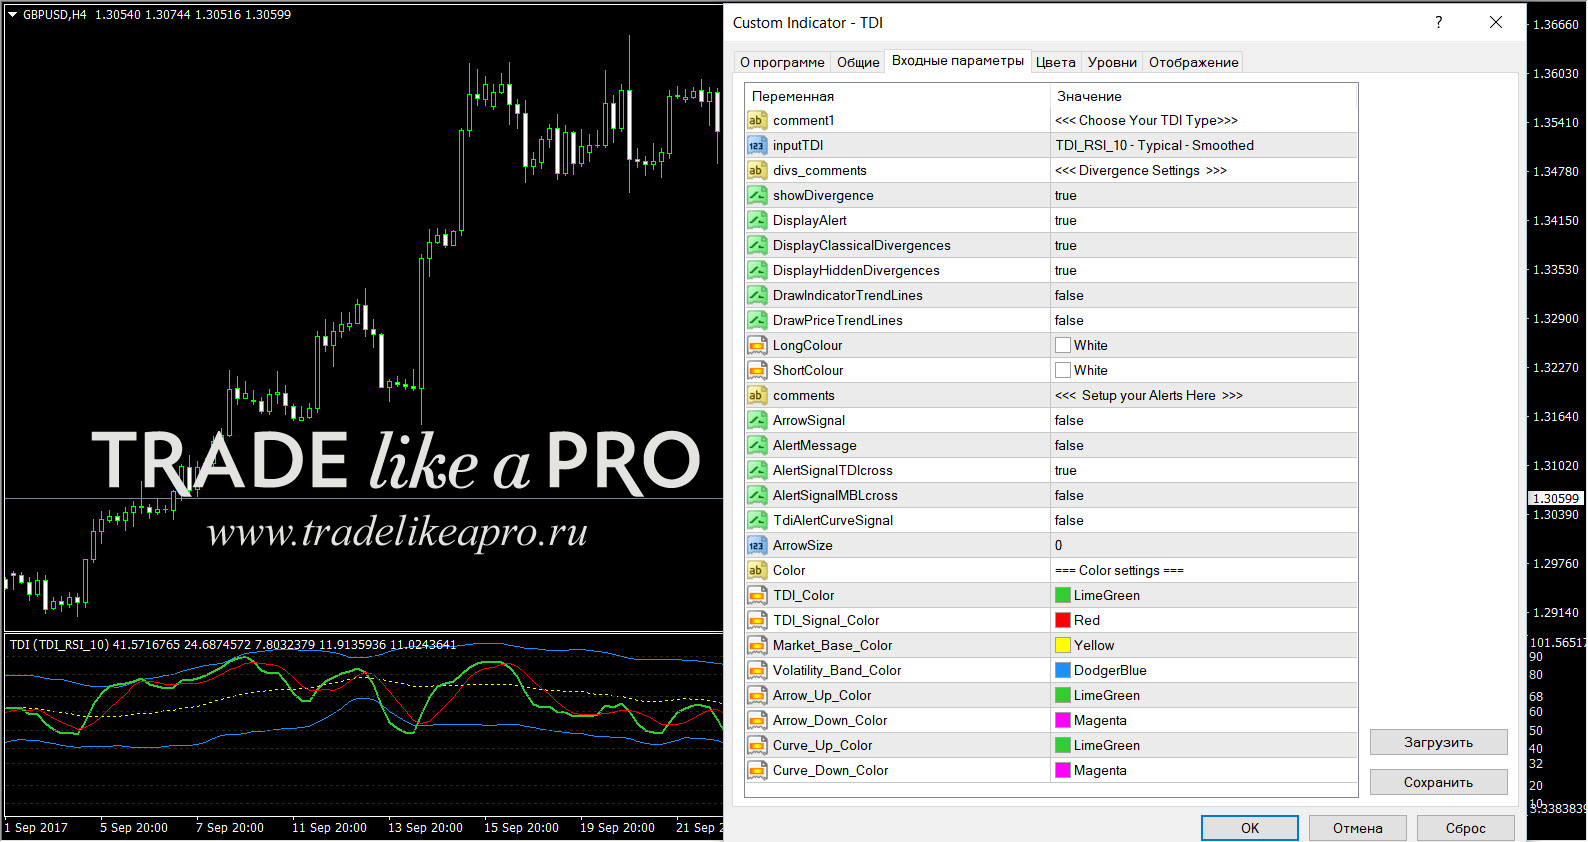
TDI
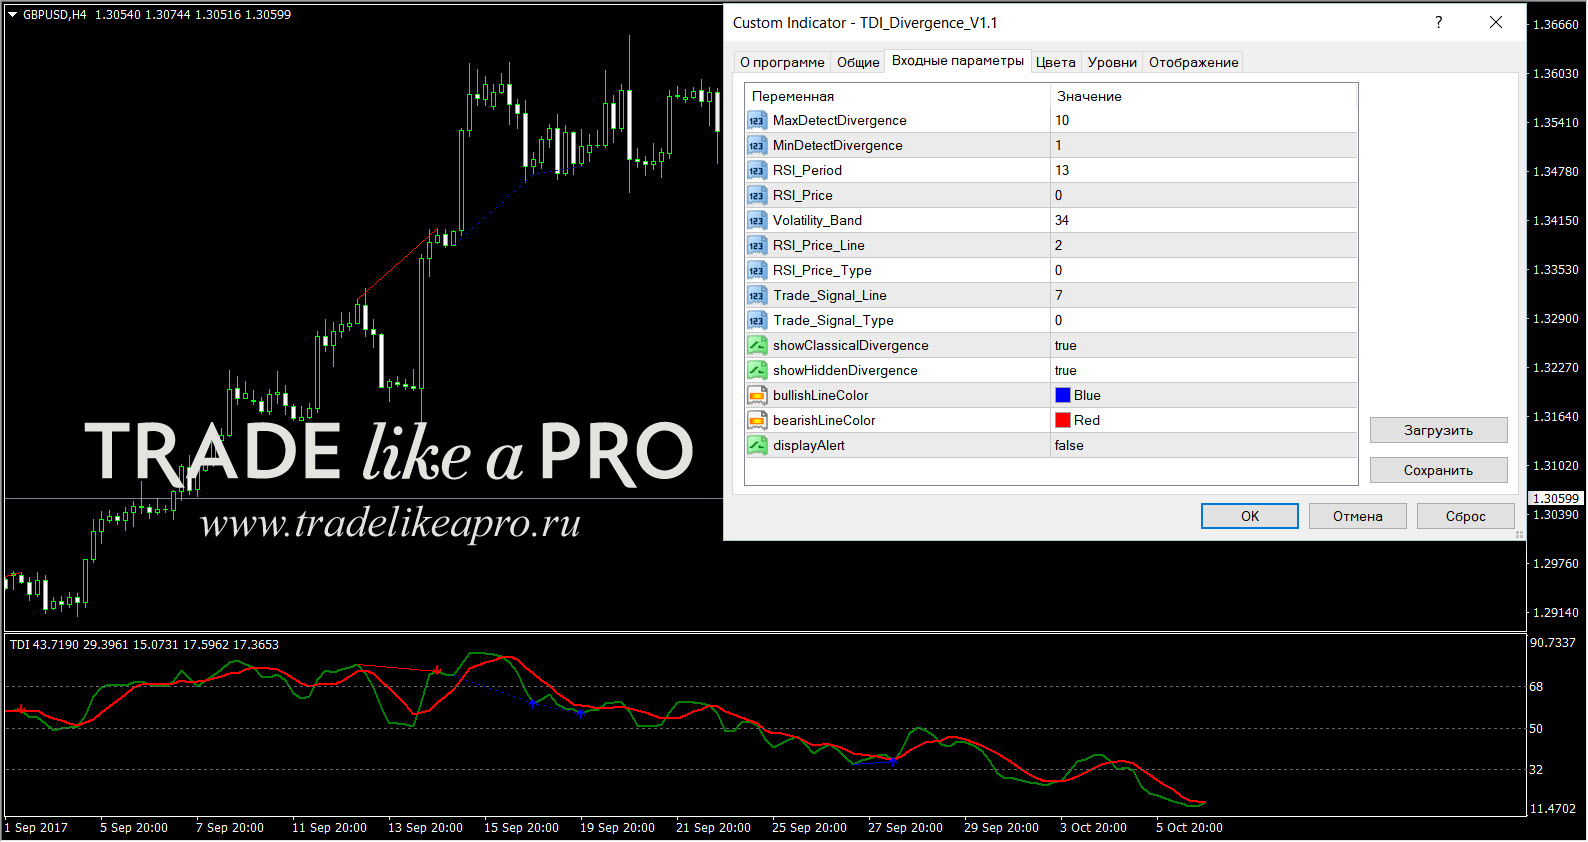
TDI_Divergence_V1.1
TDI_mtf+alerts 2 b600+
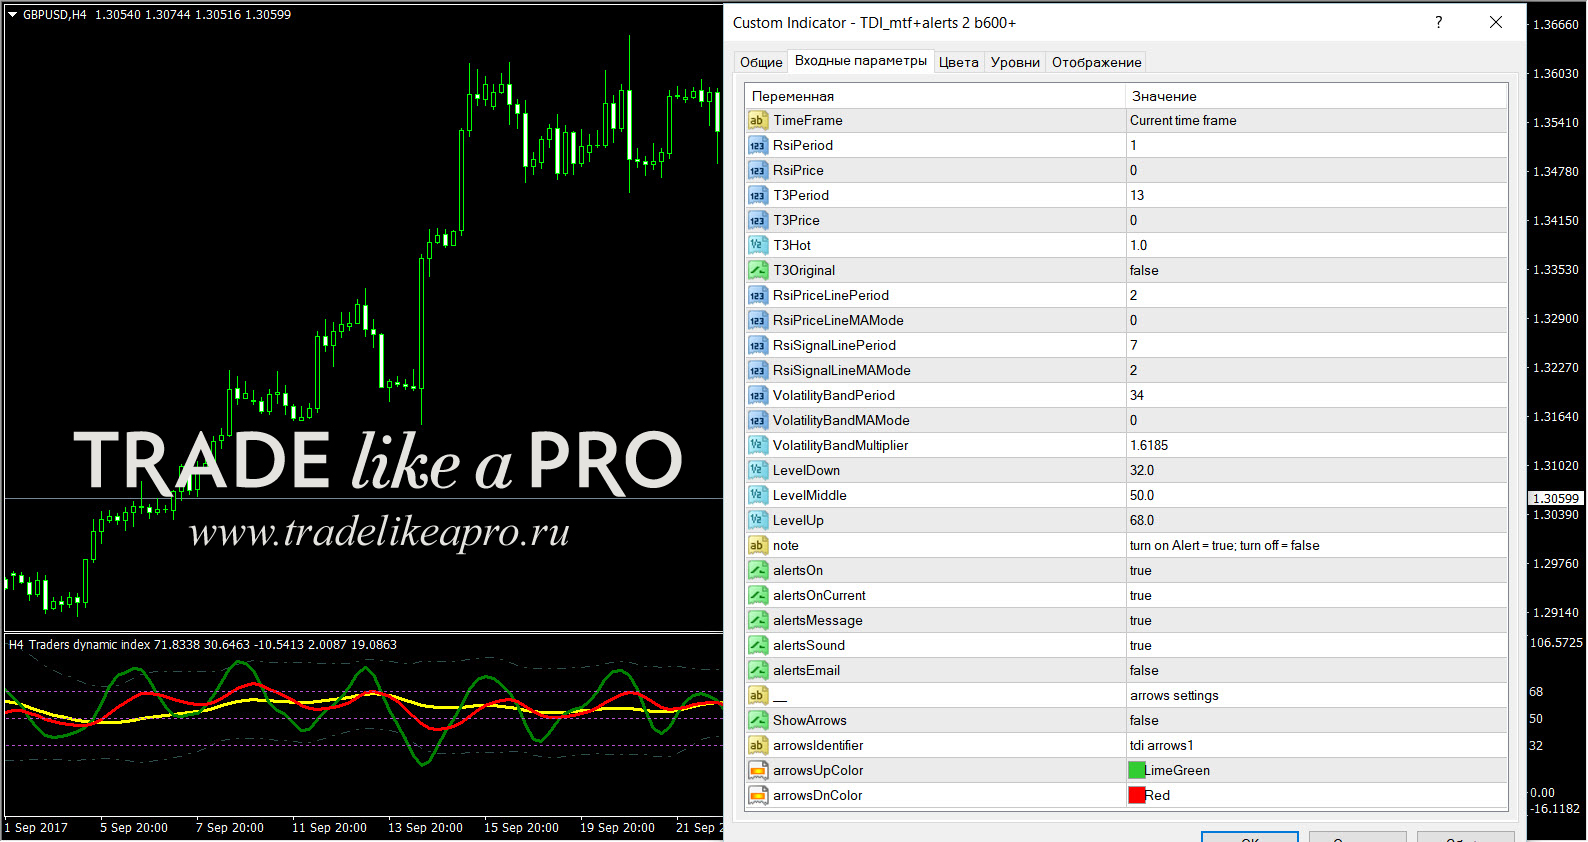
TDI_mtf+alerts b600+
TDI_RSI_10
TDI_RT alerts + divergence
TDI_RT
tdi_smoothed2_amp_alerts
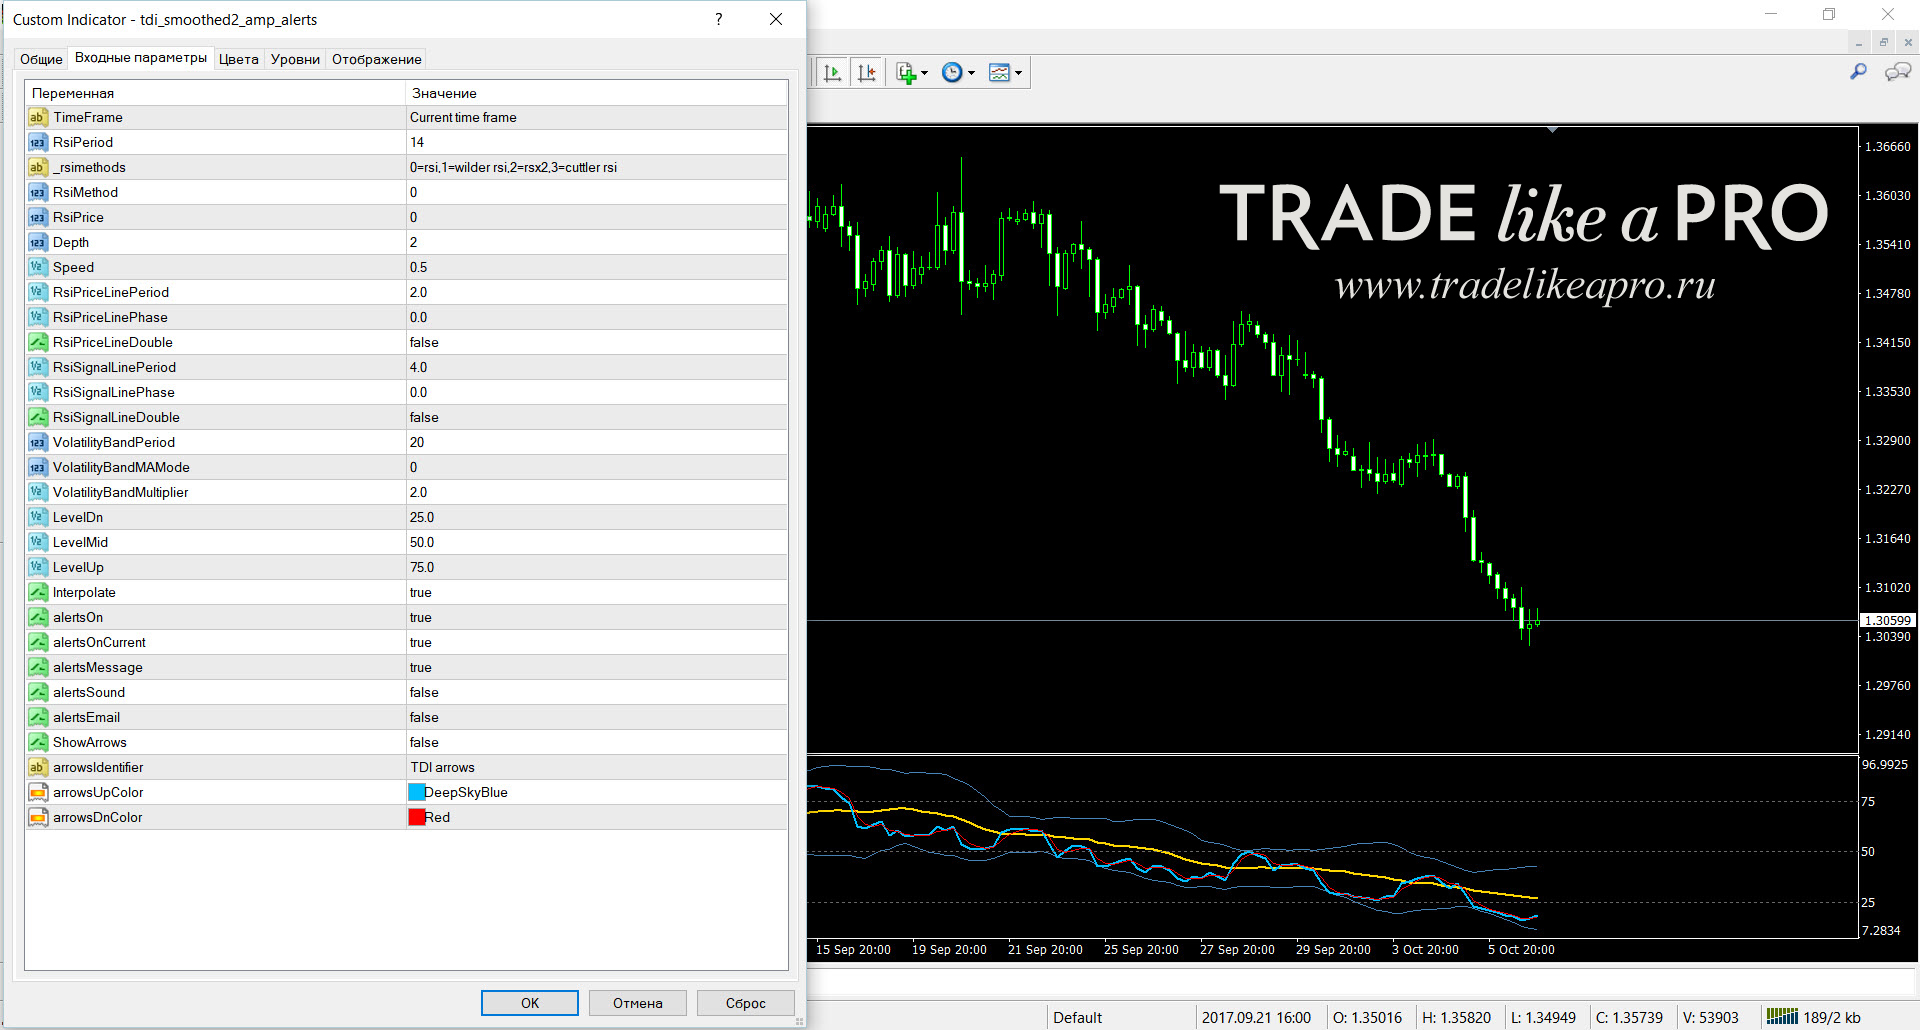
TDI_TradeAnnouncer
TDI-Arrow v1.00
TDIModFac
TDI-MTF v1.02
TDI-MTF v1.600
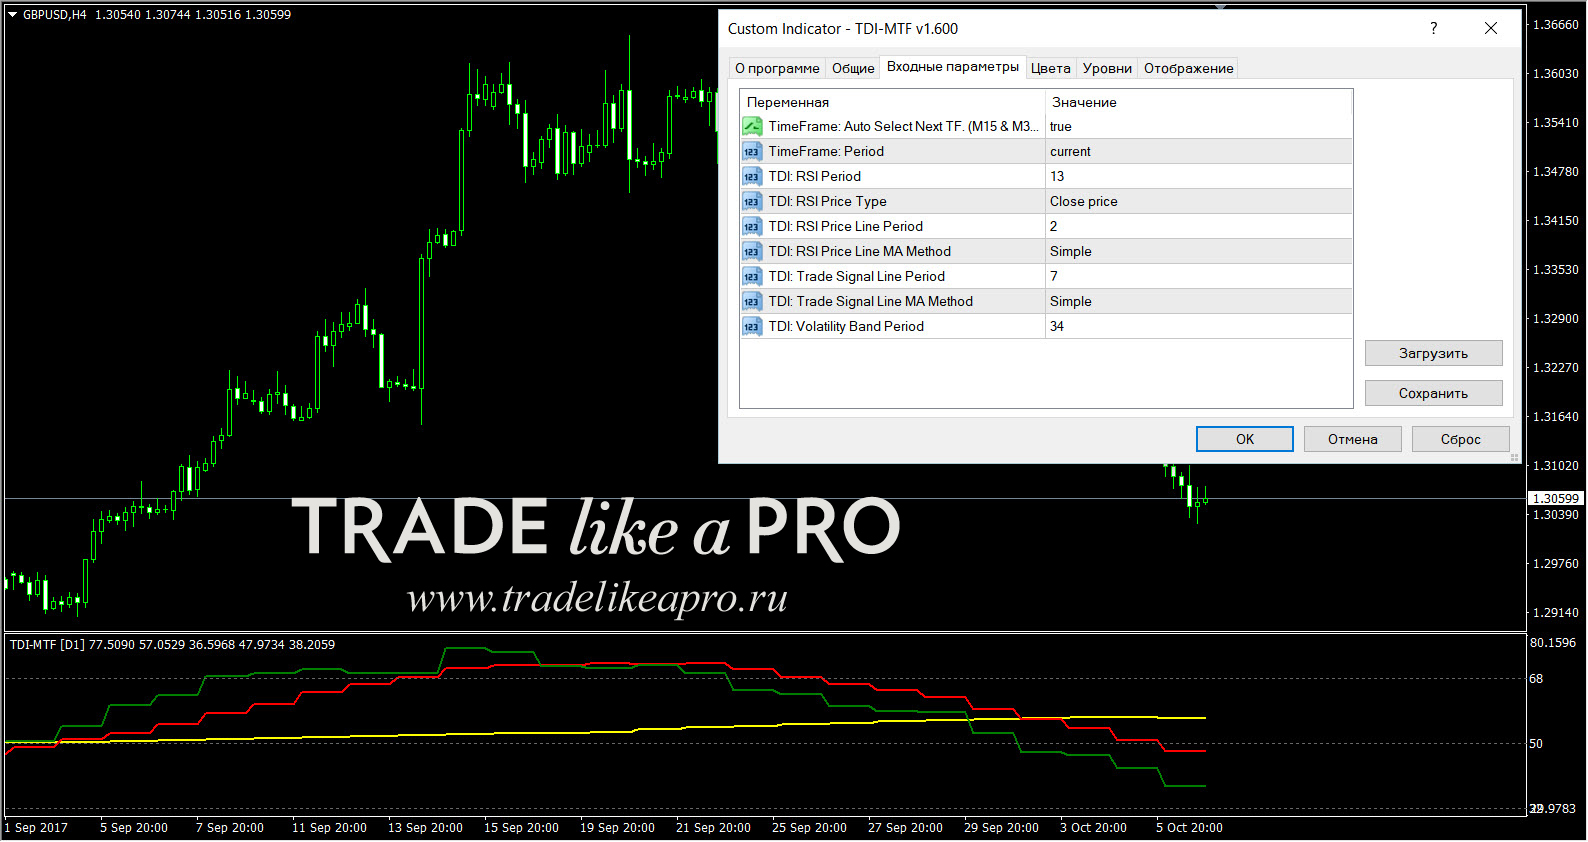
TDI-MTF
TDI-MTF-zz
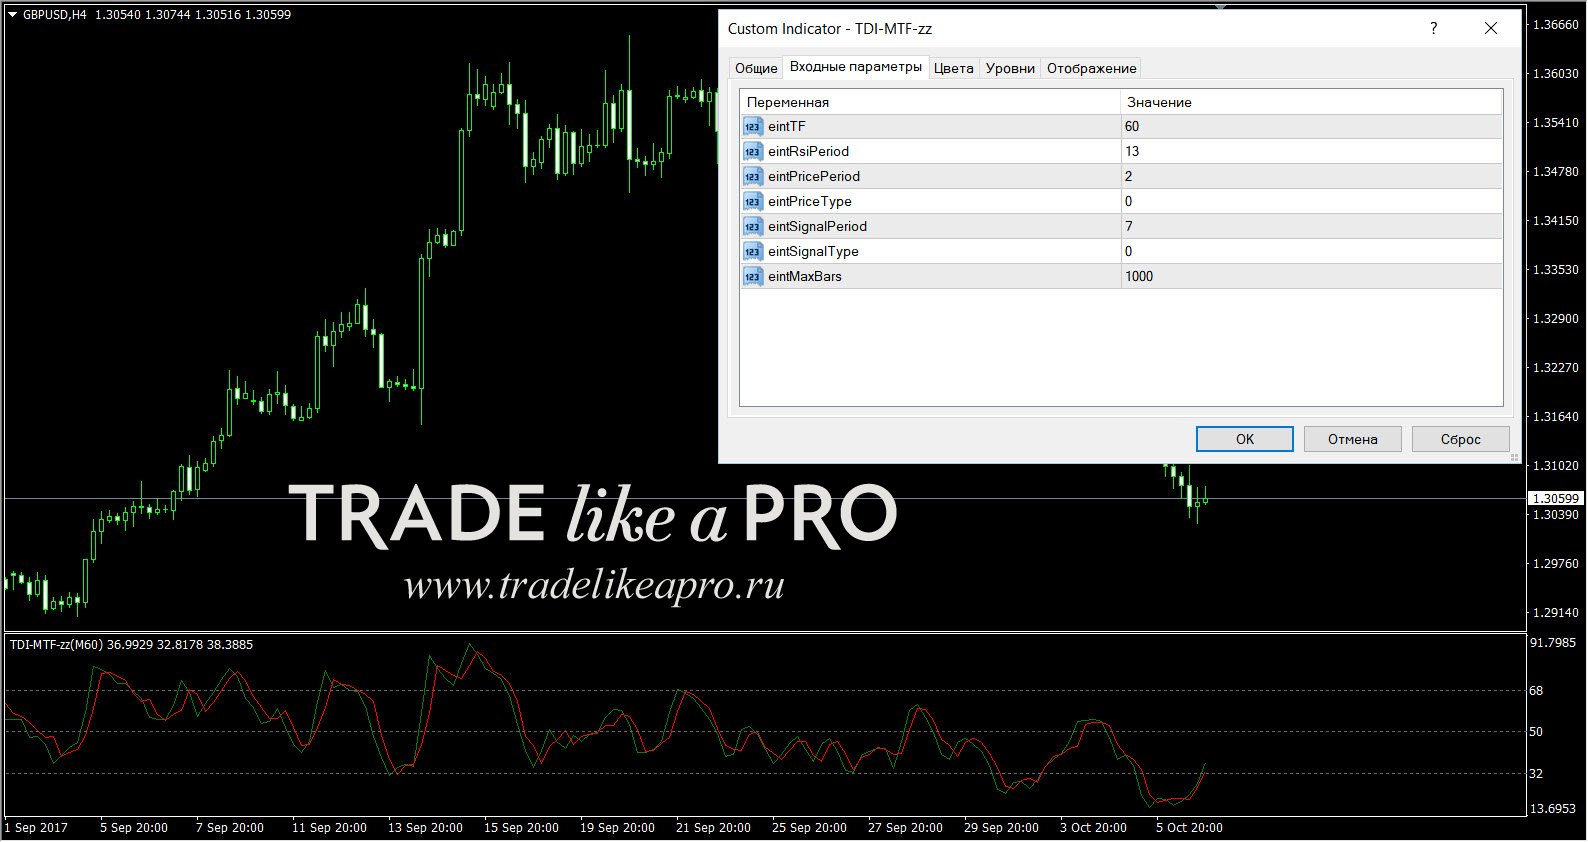
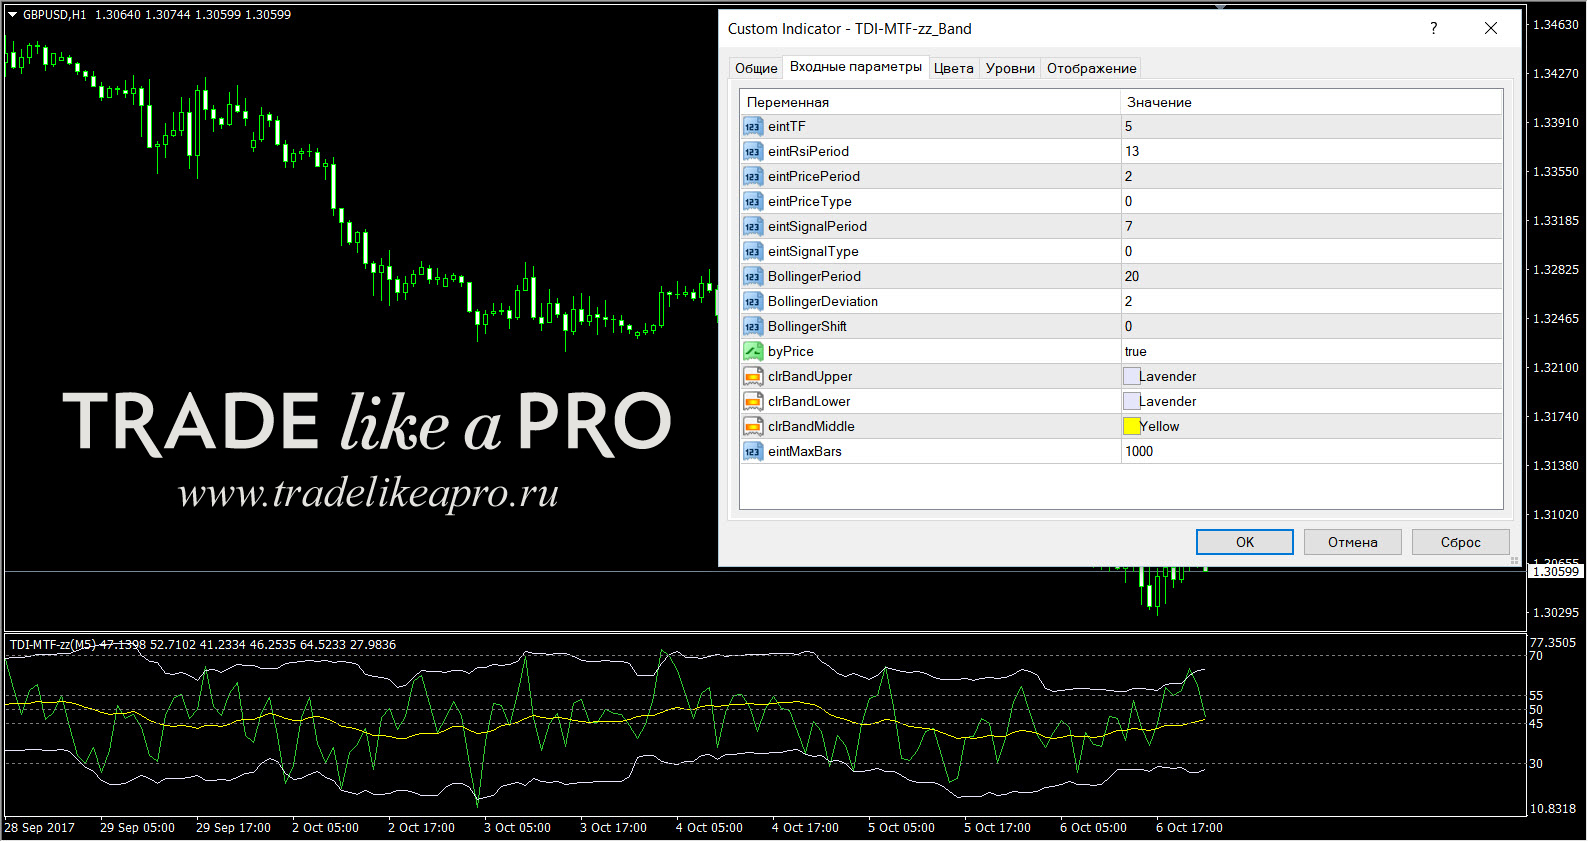
TDI-MTF-zz_Band
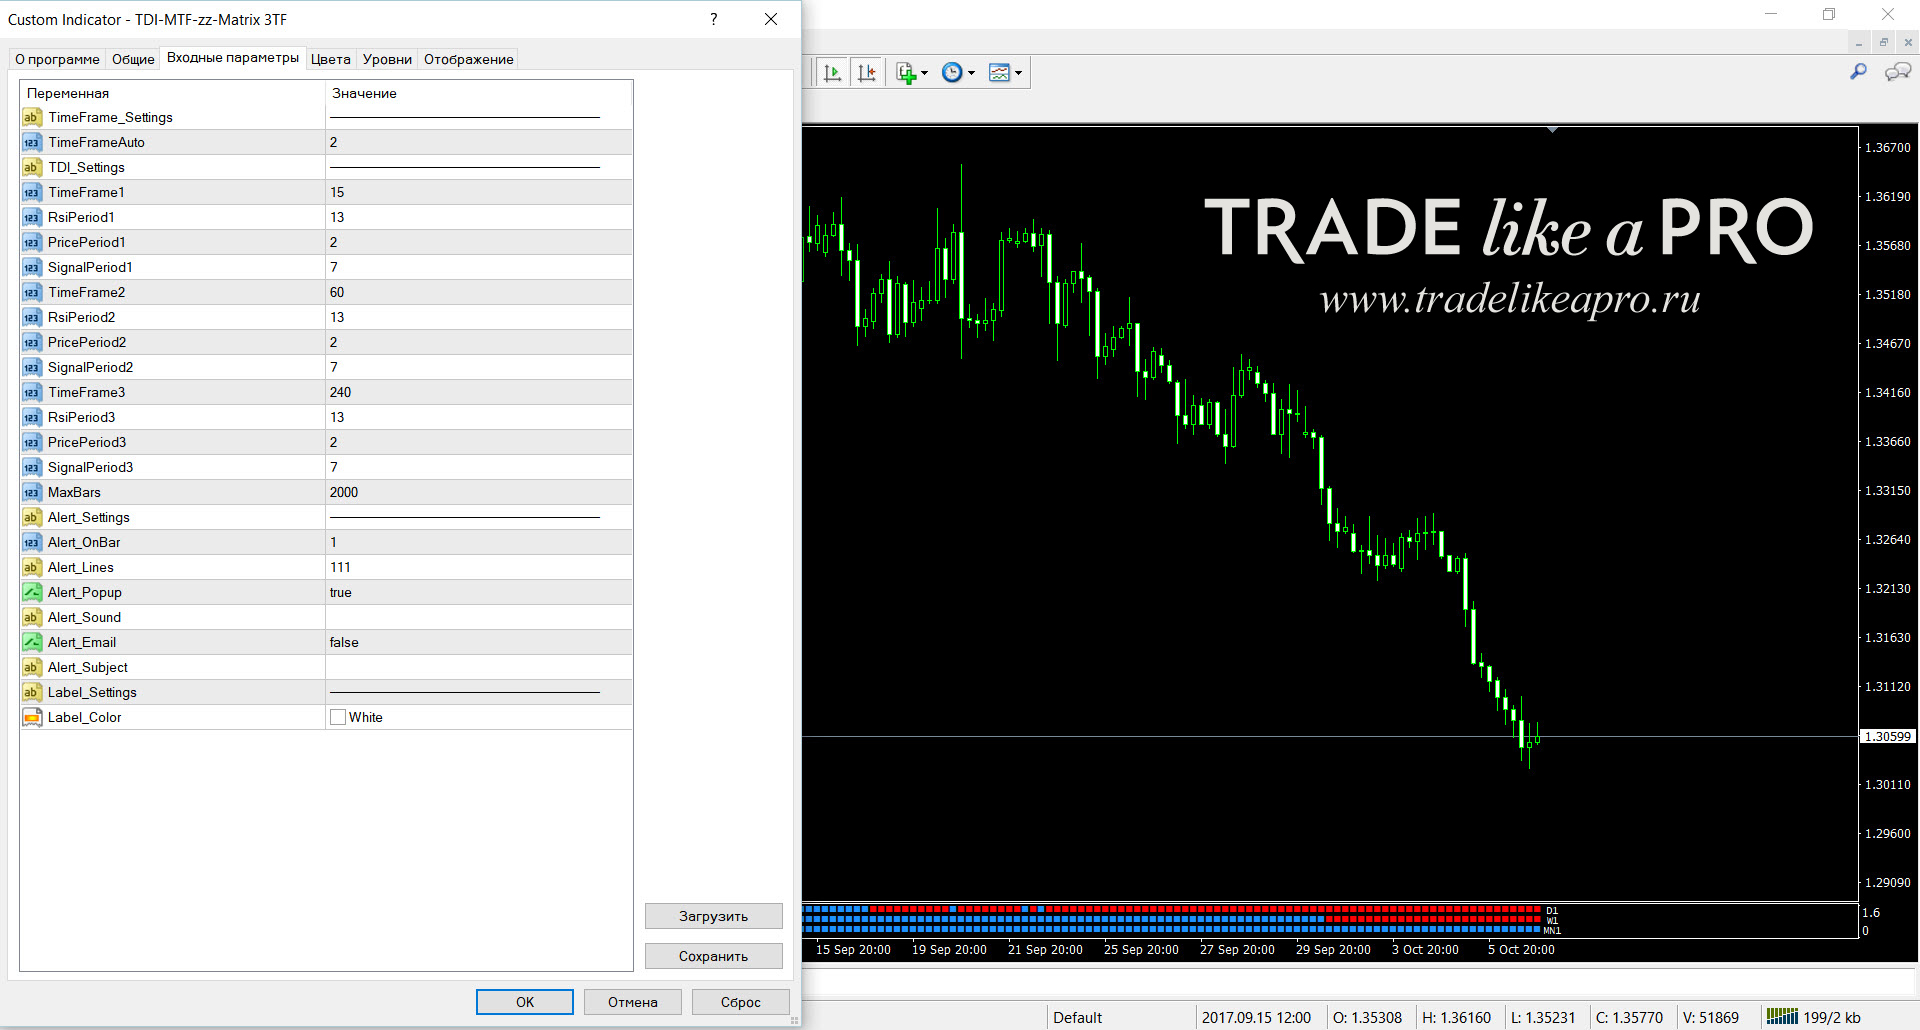
TDI-MTF-zz-Matrix 3TF
TDINoInput
TDINoInputC
TDI-RGo
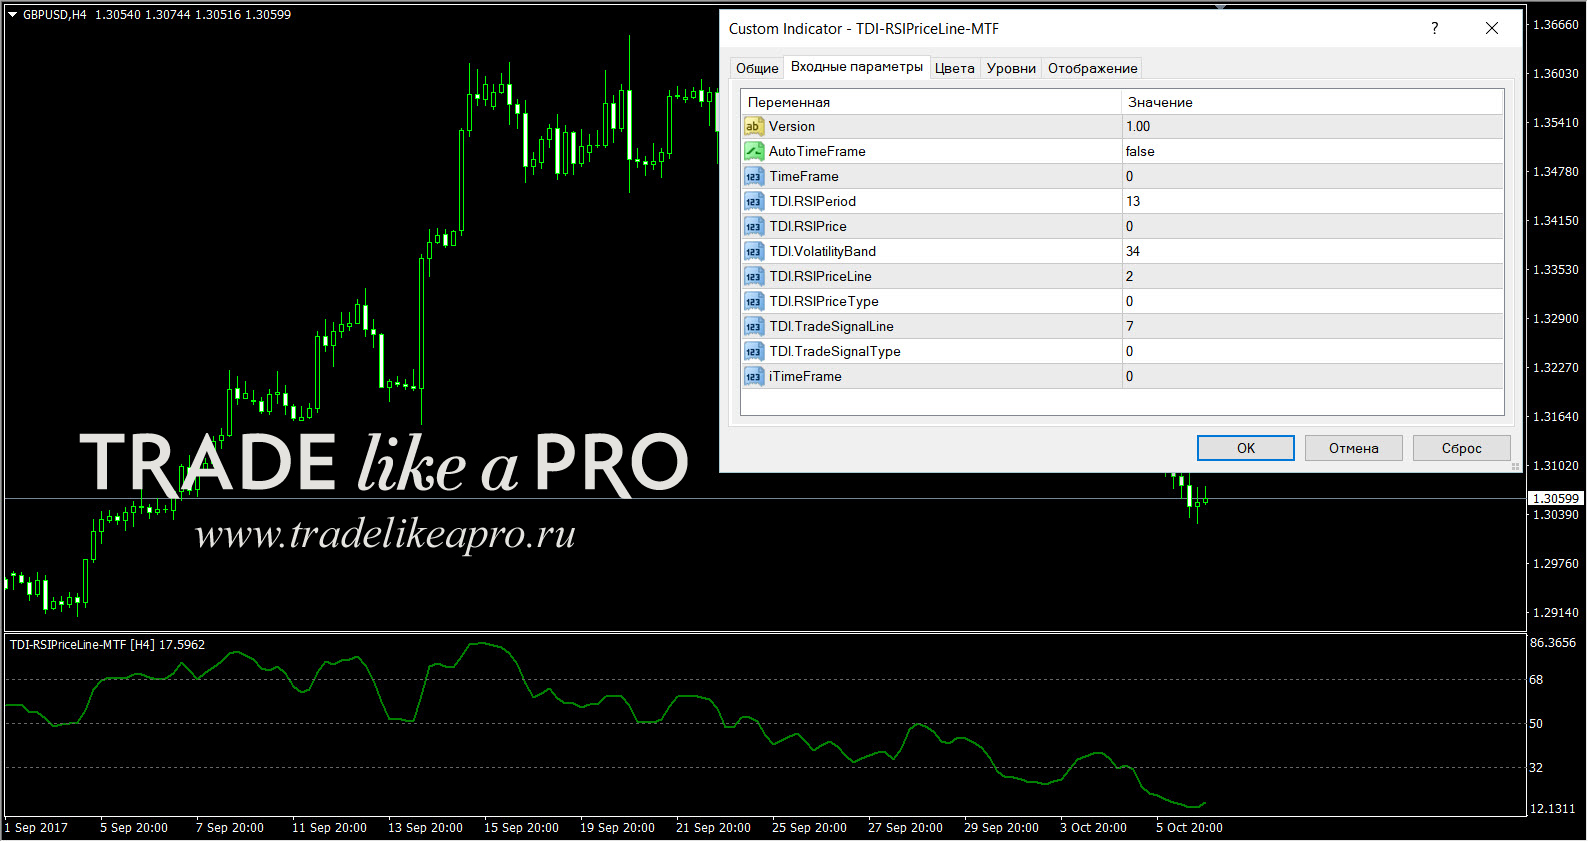
TDI-RSIPriceLine-MTF
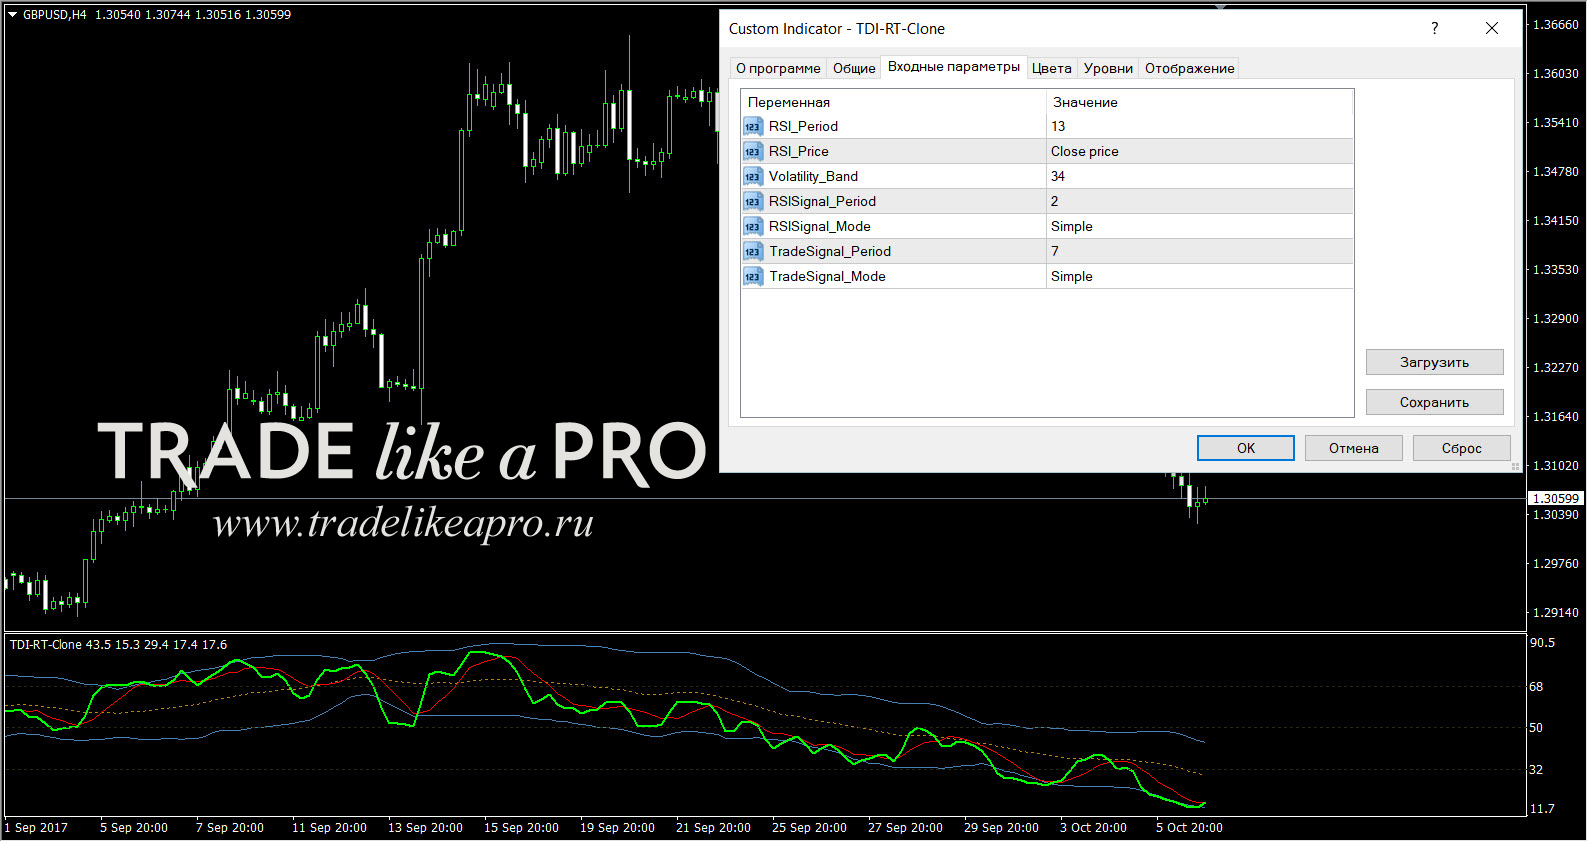
TDI-RT-Clone
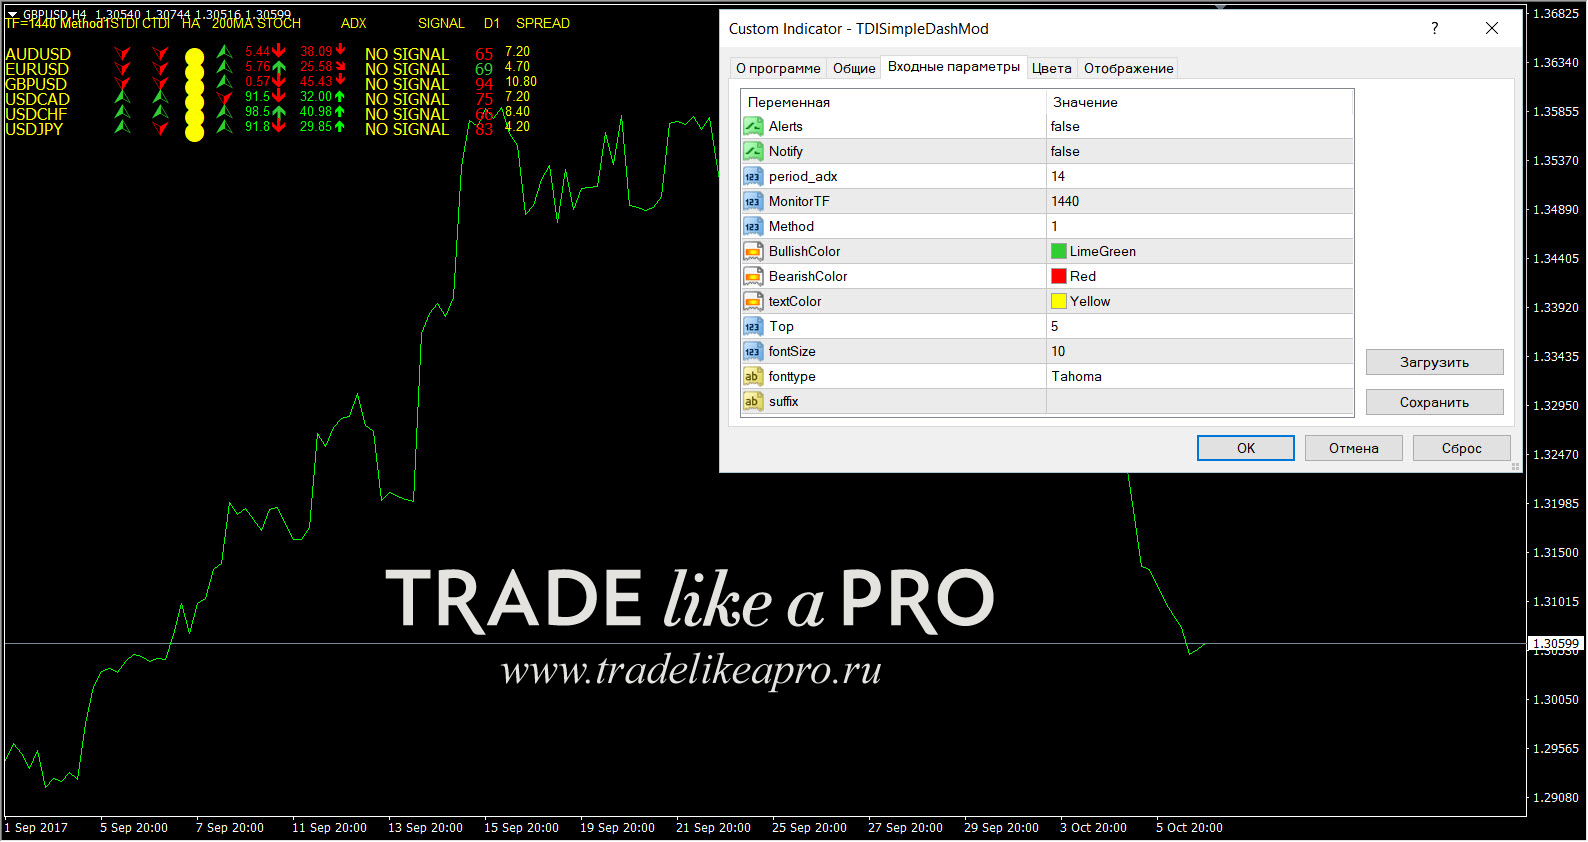
TDISimpleDashMod
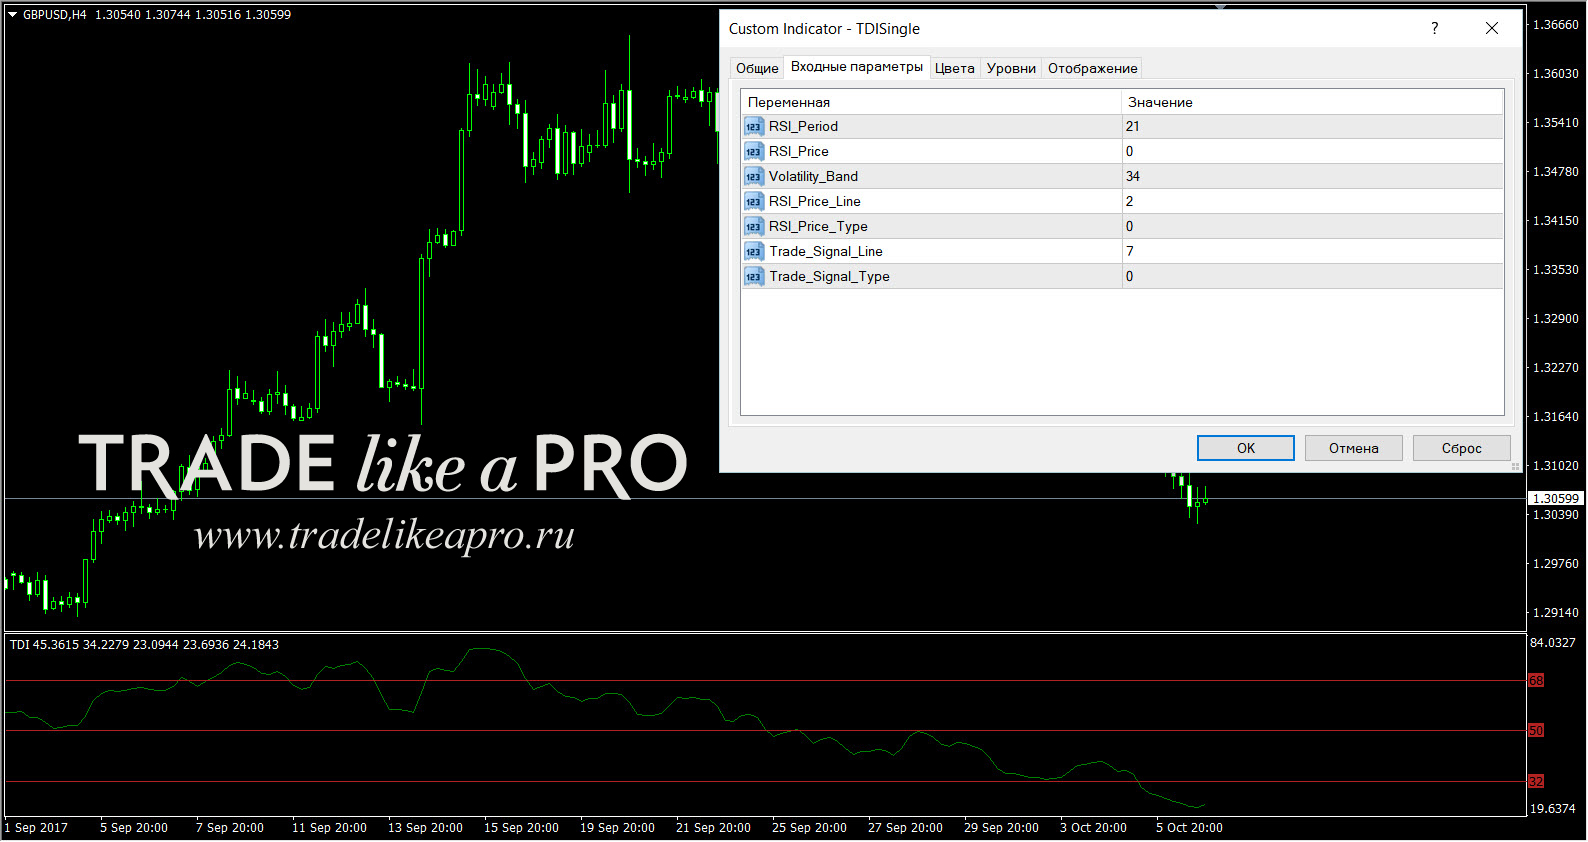
TDISingle
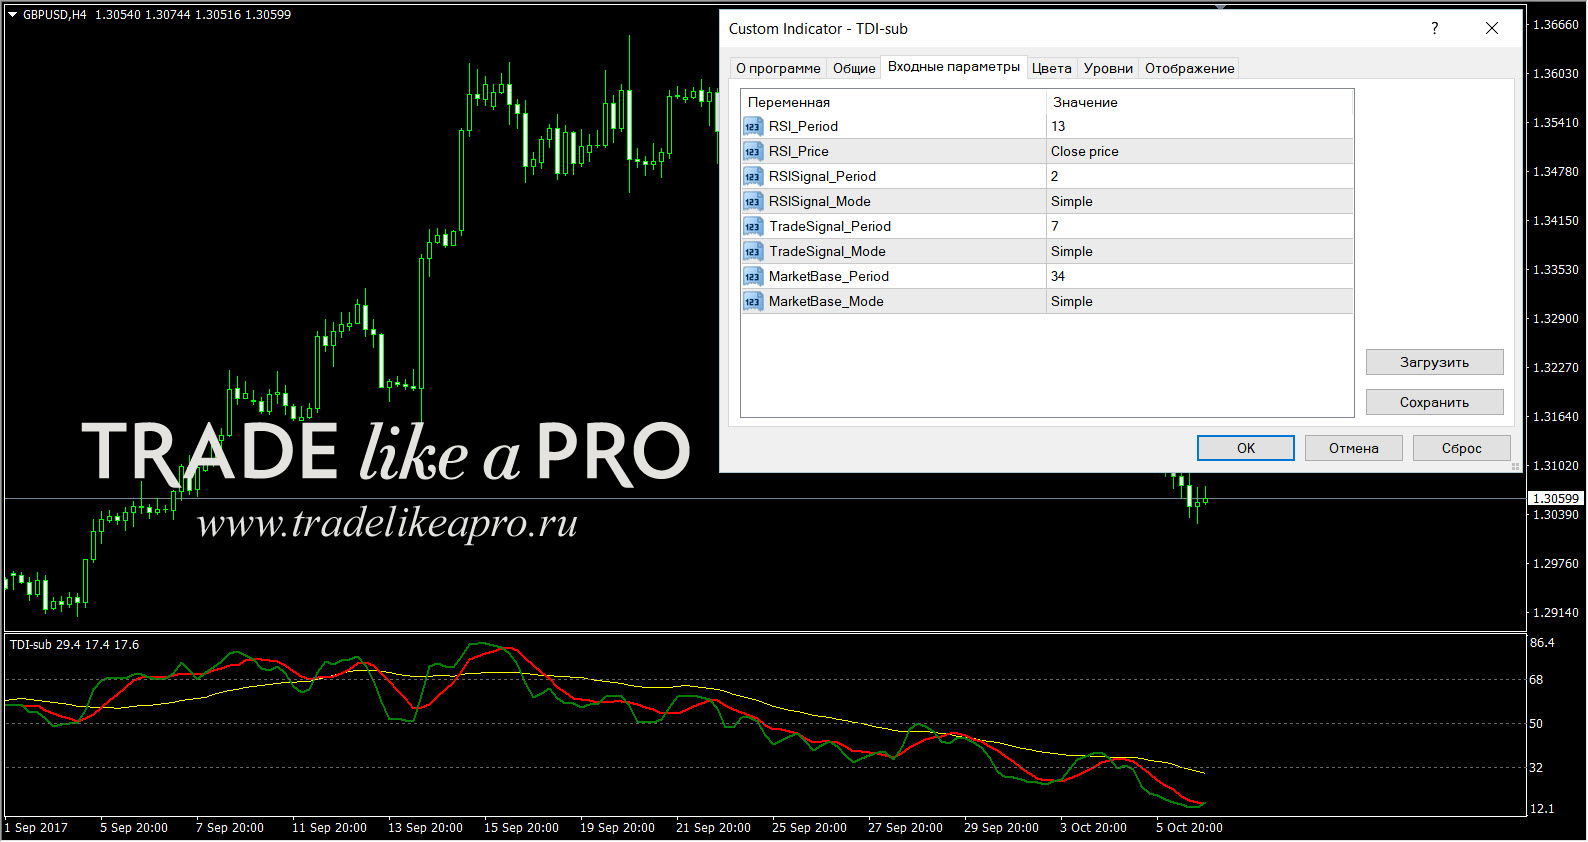
TDI-sub
TDI-TL
TDI-With Alerts
TMS-Matrix 3TF
TMS-MTF
TMS-Tape MTF
TMSTDI_WatchDog
Traders Dynamic Index SSA ep_sharp - main chart
Traders Dynamic Index VISUAL ALERTS
Traders Dynamic Index
Traders_Dynamic_Index
TradersDynamicIndex
xTDI Strong-Histo v1.01
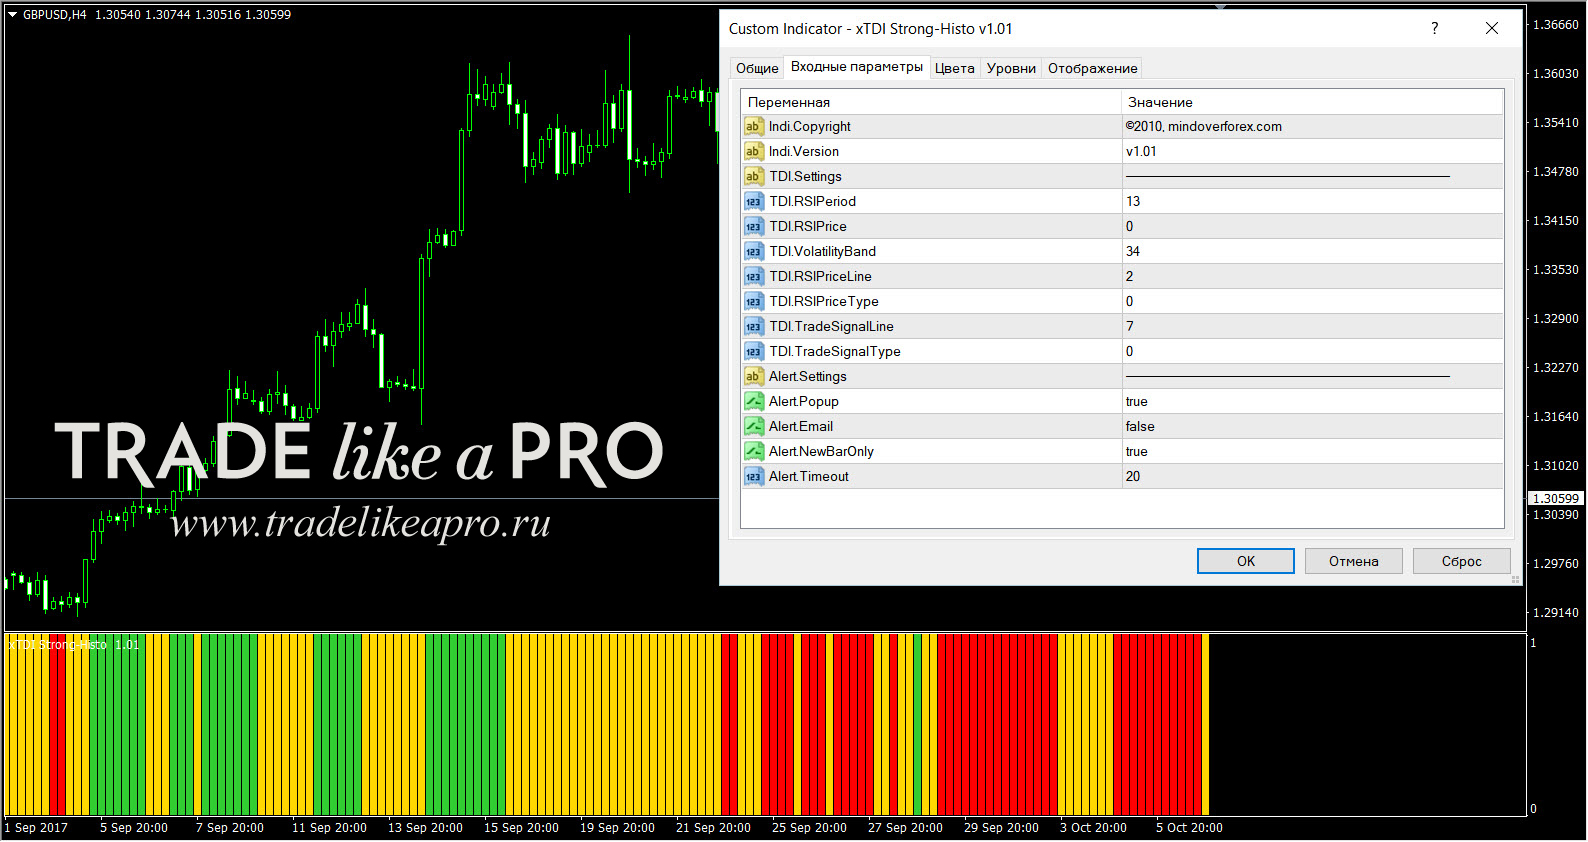
xTDI-Arrow v1.00
xTDI-Histo v1.10

xTDI-Histo v1.11
МАНУАЛЫ
Dean Malone - Take it E.A.S.Y.! (ENG)
kbp post 17780 reply (ENG)
SYNERGY_Basic (ENG)
Synergy_Pro_Ebook_v.5.12 (ENG)
TDI substitute for ANDROID (ENG)
TDI Versions Compare (ENG)
Test for 2-7MA versus TDI (ENG)
The TDI indicator - overview and settings.fxdaytrader (ENG)
TMS H1 Trading by Phx62 23 Apr (ENG)
Traders Dynamic Index (ENG)
Trading made simple (ENG)
Trading Made Simple BigE (Eric)'s posts (ENG)
Trading Made Simple Worksheet (ENG)
ПОЛЕЗНЫЕ ССЫЛКИ
Как установить индикатор в терминал МТ4
Как тестировать индикатор в терминале МТ4
Как настроить уведомления на почту в MT4
Как компилировать старые MQ4 файлы под новые билды MetaTrader 4
Расшифровка часто встречающихся сокращений в названии индикаторов.
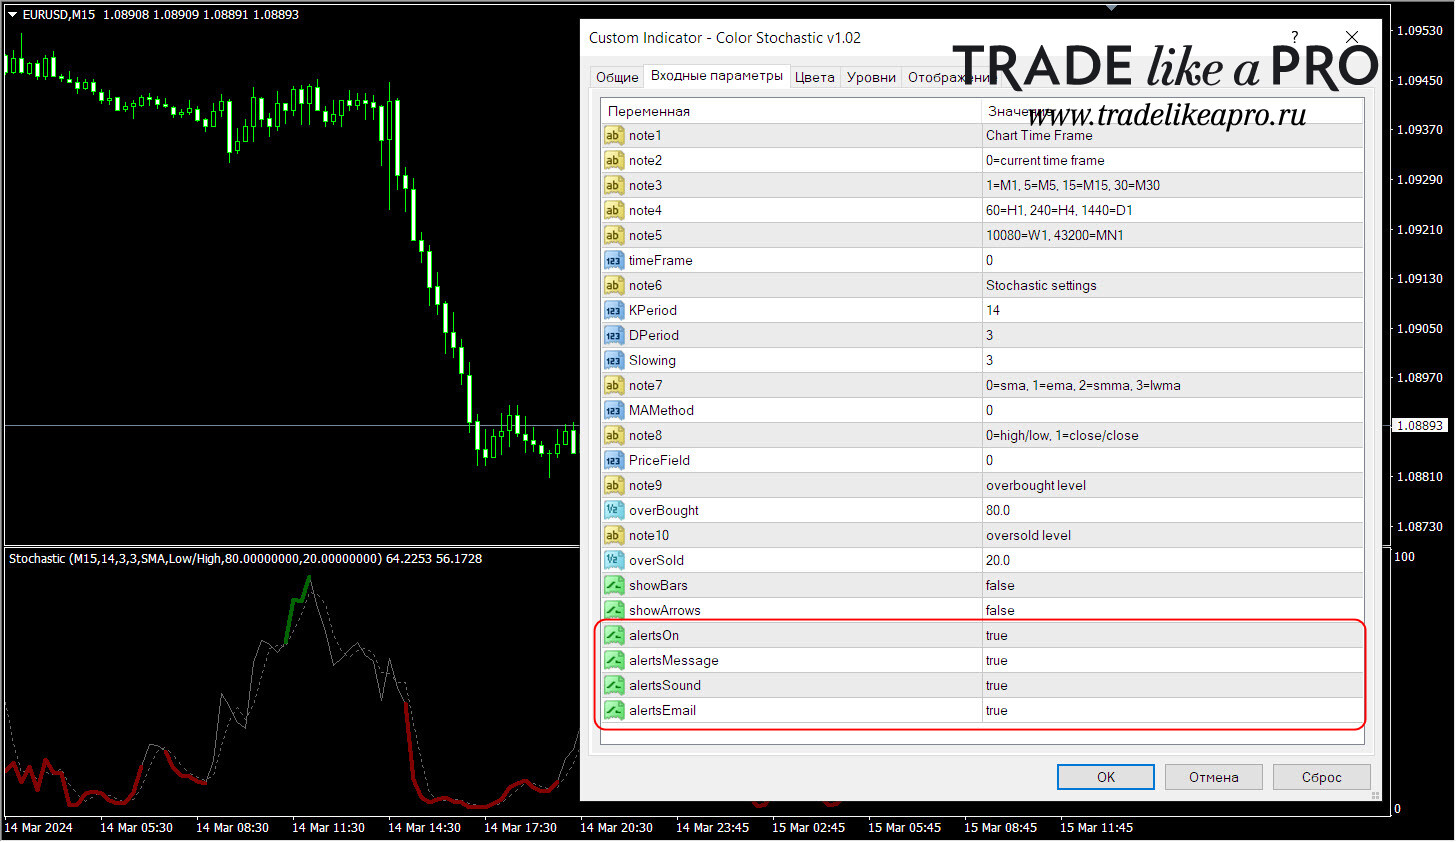
alert - перевод с английского - сигнал. Индикатор при достижении определённых значений, установленных пользователем в настройках, посылает сигнал (разными способами - звуковой, уведомление на почту и так далее).
Пример:
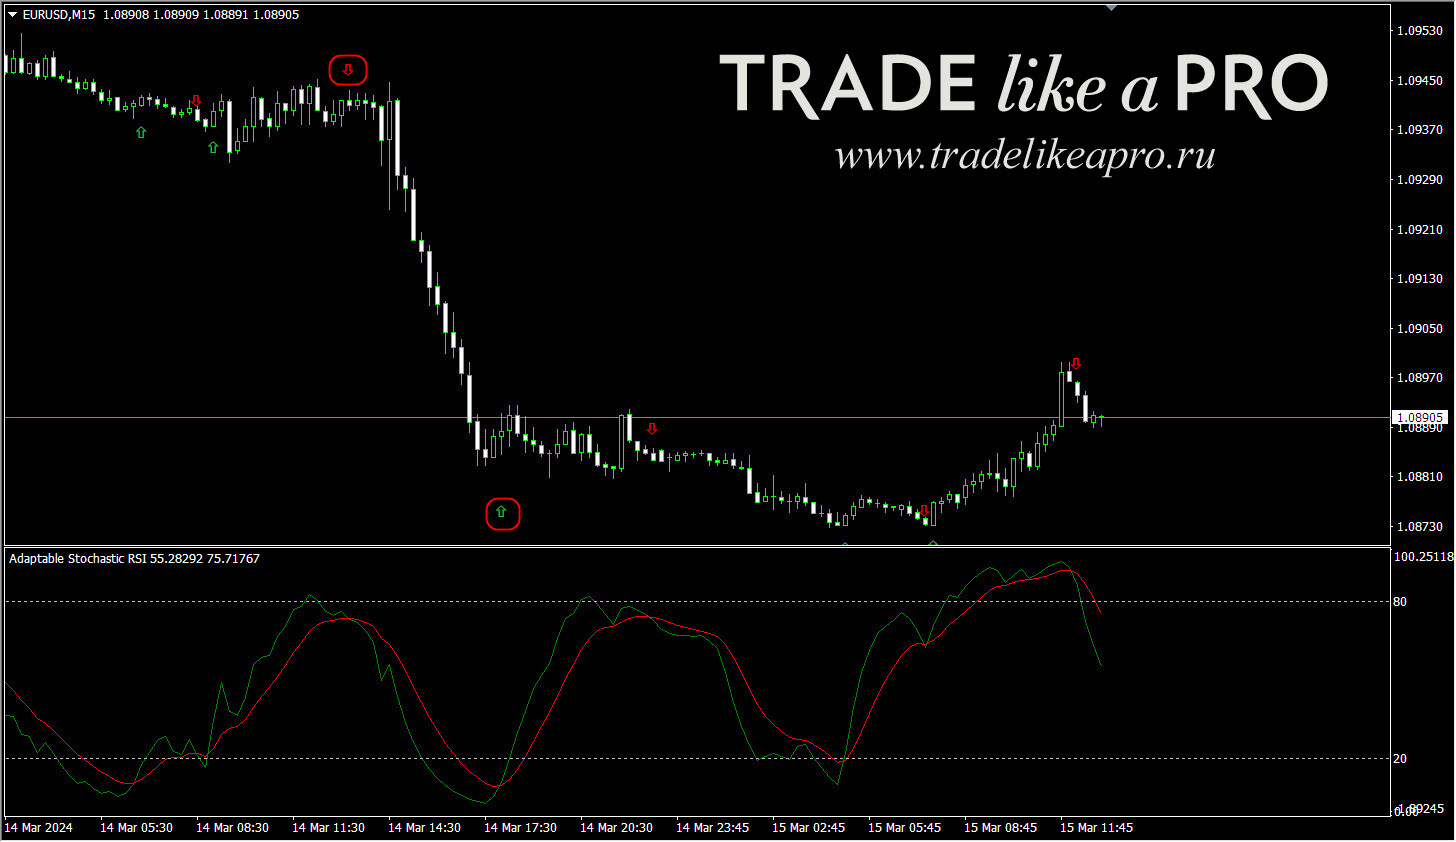
arrows - перевод с английского - стрелки. Индикатор может отображать стрелками на графике возможное движение цены в этом направлении.
Пример:
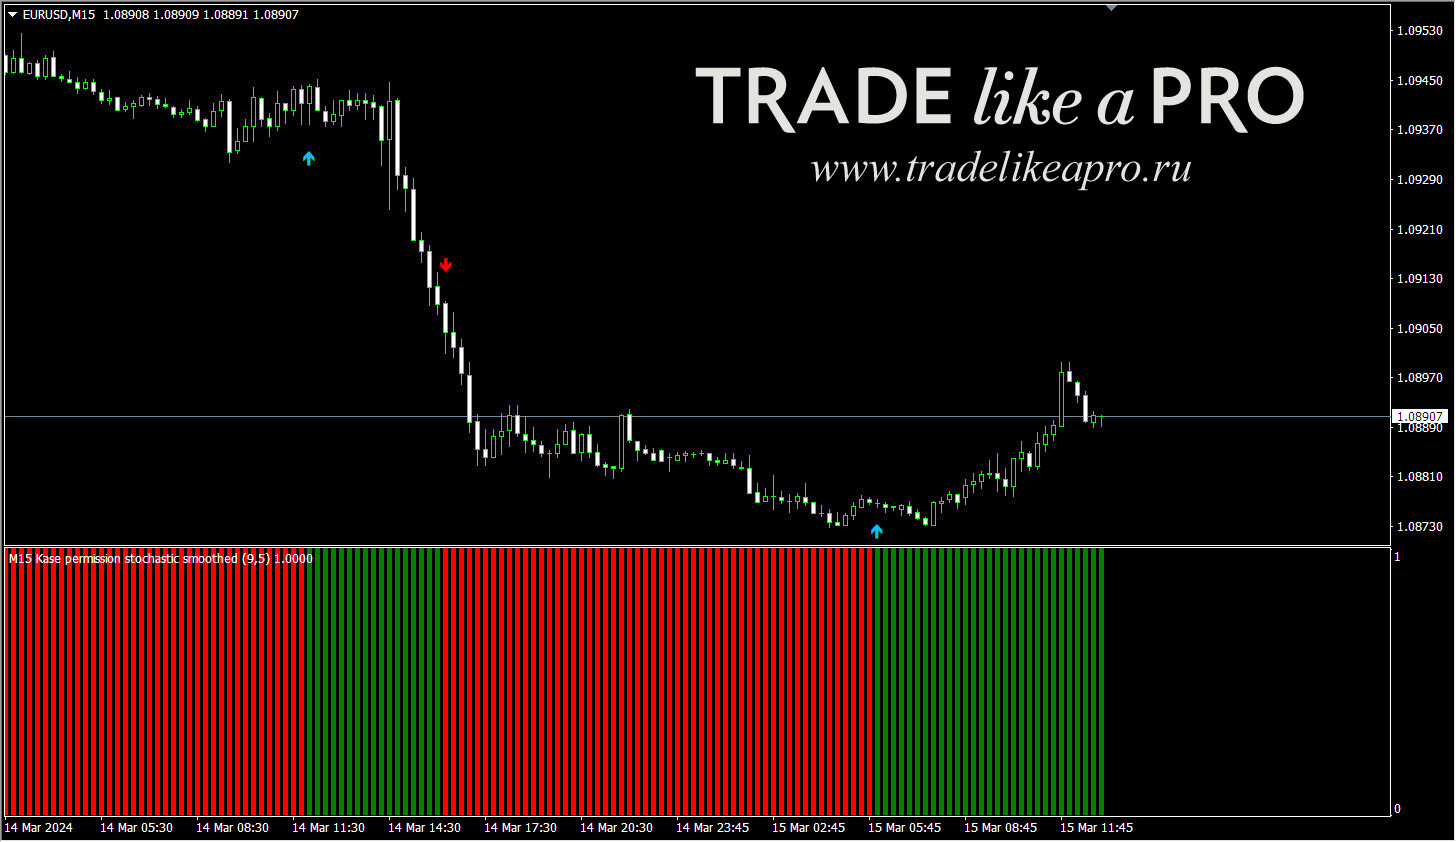
Histogram (Hist) - перевод с английского - гистограмма. Показания индикатора в виде гистограммы.
Пример:
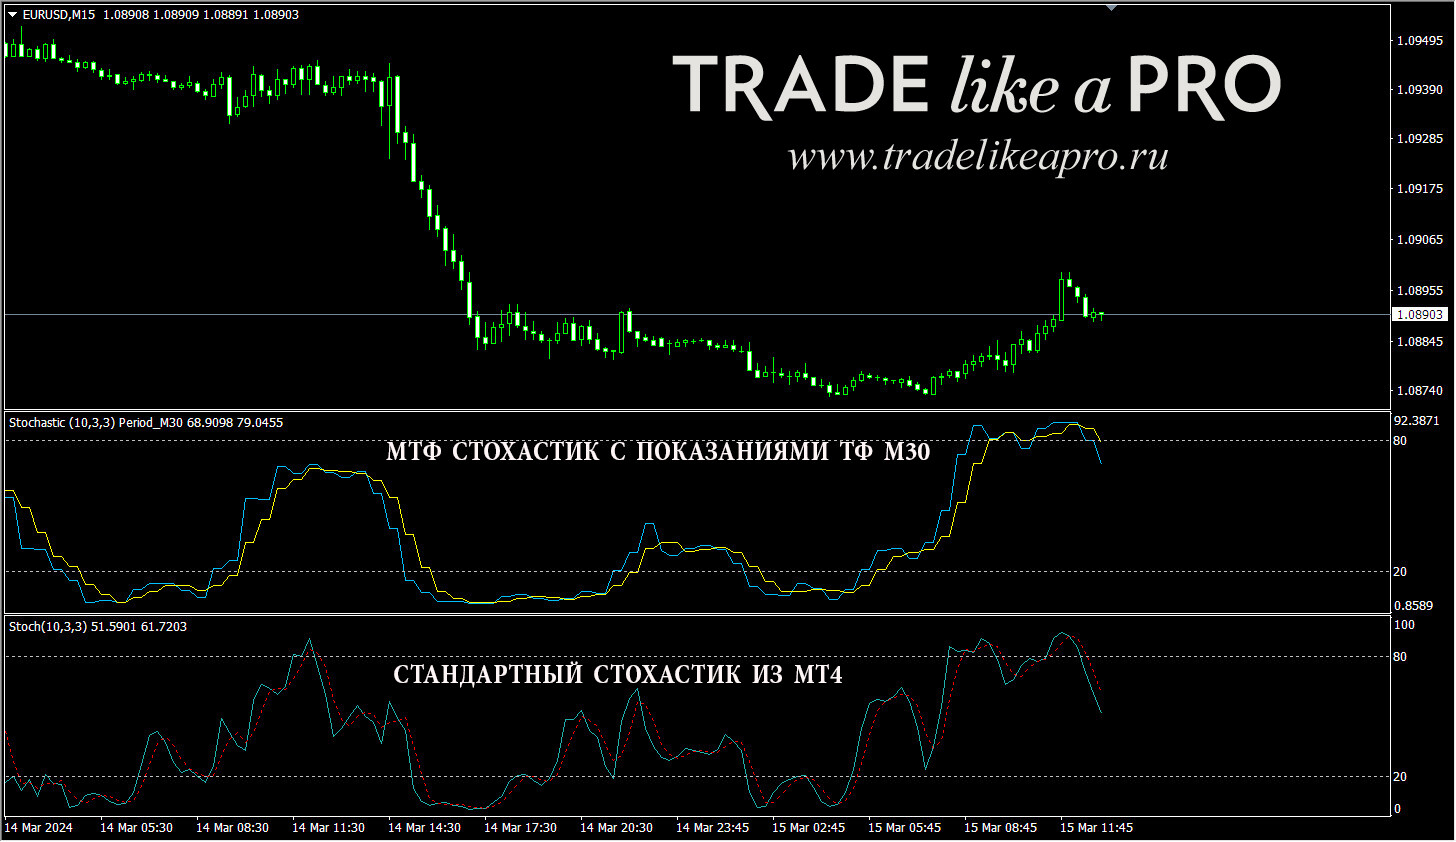
mtf - Multi Time Frame - перевод с английского - мультитаймфреймовый индикатор. Индикатор на установленном таймфрейме отображает данные с более старшего периода. Пока свеча старшего периода не закрыта - индикатор может менять свои показания.
Пример:
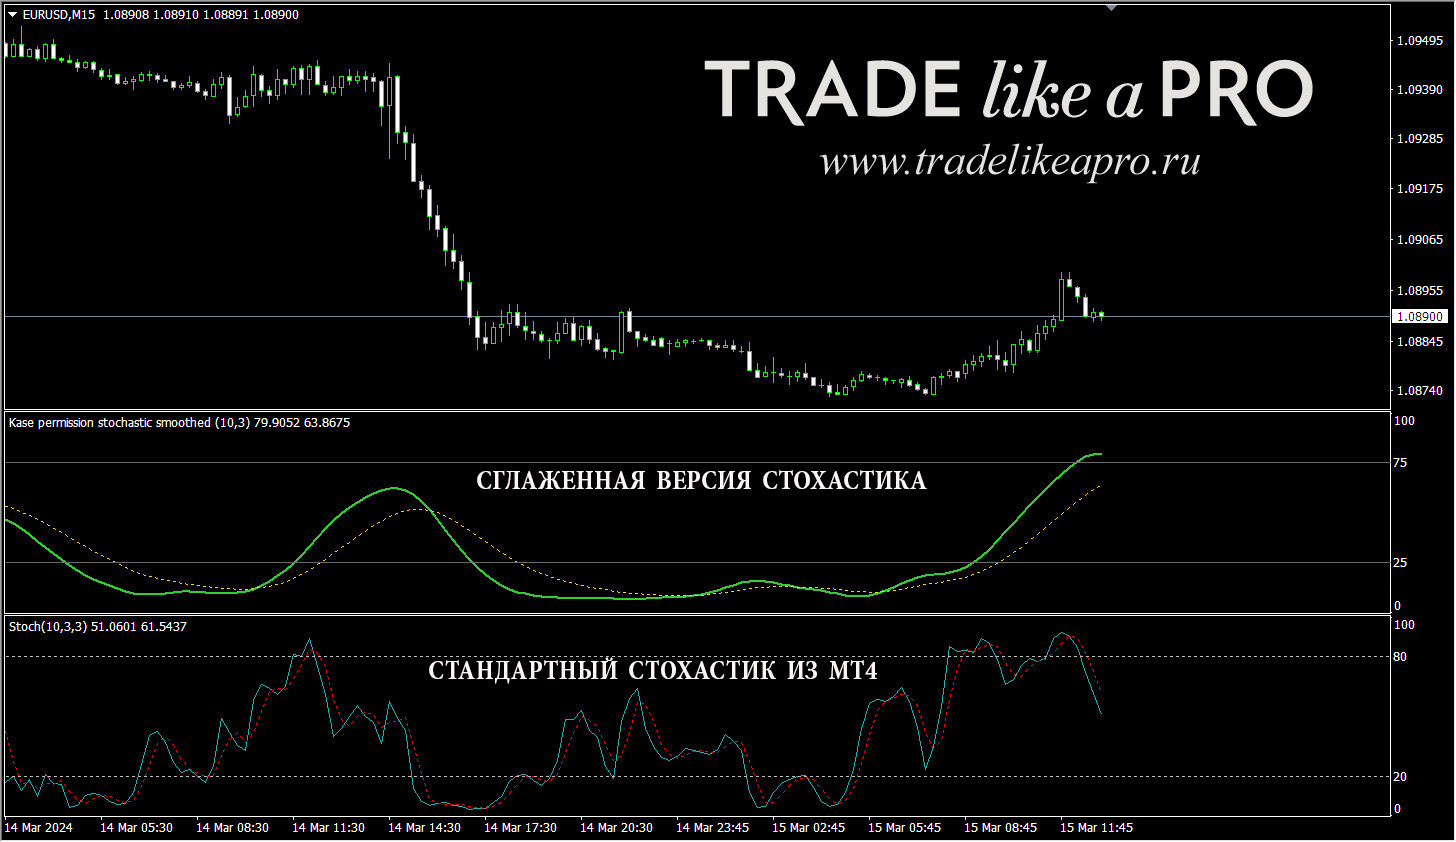
Smoothed - перевод с английского - сглаженный. Индикатор на установленном таймфрейме отображается в виде плавных линий.
Пример:
ИСТОРИЯ ОБНОВЛЕНИЙ
НАБОР TDI (2016.11.25) 354 загрузок
МАНУАЛЫ по индикатору TDI (2016.11.25) 281 загрузок
НАБОР_TDI_2017.10.07.zip
МАНУАЛЫ_по_индикатору_TDI_2017.10.07.zip